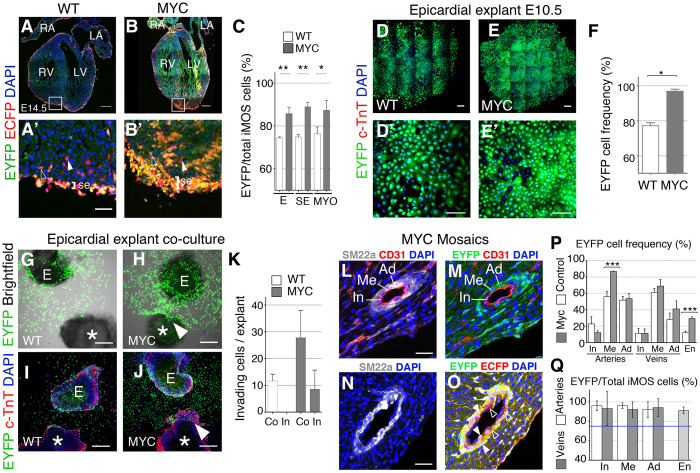
Figure 3. Progressive overcolonization of the epicardium and epicardial derivatives by Myc-overexpressing cells.
(A–B’) Confocal images from histological sections of iMOSWT(WT) (A) and iMOST1-Myc(MYC) (B) hearts at E14.5 induced with Wt1-Cre. (A’,B’) show magnification of the boxed areas in (A) and (B). Co-localization of EYFP native fluorescence and anti-GFP immunofluorescence (in red) detects both ECFP (filled arrowheads) and EYFP (open arrowheads) cells. (C) frequency of EYFP cells with respect to total iMOS-recombined cells in epicardium (E), subepicardium (SE) and myocardium (MYO). Throughout the figure WT refers to iMOSWTmosaics and MYC to iMOST1-Mycmosaics. (D,E’) 6-day old epicardial cultures and magnifications (D’,E’). (F) Quantification of the EYFP frequency within the epicardial explants. (G,H) Co-culture of E10.5 epicardium and a WT E9.0 heart. (I,J), Similar cultures as shown in (G,H) showing a maximum fluorescence intensity projection (Z = 36 μm). (*) indicates the WT heart and (E) the epicardial explant. Arrowhead shows invading EYFP-Myc epicardial-derived cells. K Quantification of epicardial cells per explant that colonize (Co) or invade (In) the WT myocardium. (L–O) Confocal image of histological sections from a P0 iMOST1-Mycheart showing EYFP-Myc perivascular colonization. (L–O) show the co-localization of vessel layer markers with alone or combined with EYFP and/or anti-GFP (red). EYFP+ cells, filled arrowheads, ECFP+ cells, open arrowheads. P and Q show the quantification of EYFP+ cell contributions as described in N,O. The graph above shows the absolute contribution of EYFP cells to the large vessel layers (In: intima, Me: media, Ad: adventitia) and endothelium of the microvasculature (En). Q shows the relative contribution of EYFP cells to the total iMOS+ population in iMOST1-Mycmosaics for the same cell types as in P. The blue line in Q shows the 75% contribution expected in case of neutral expansion of both populations. Graphs in C,F,K,P show means ± SEM. *p < 0.05; **p < 0.01; ***p < 0.001. Graph in Q shows means ±95% confidence interval. Bar, 200 μm in A,B,D,E, G–J and 50 μm in A’,B’,D’,E’,L,N. n ≥ 3 hearts in A–C, n ≥ 5 in D–F, n ≥ 3 in G–K and n = 5 in L–P.

