
Figure 1.
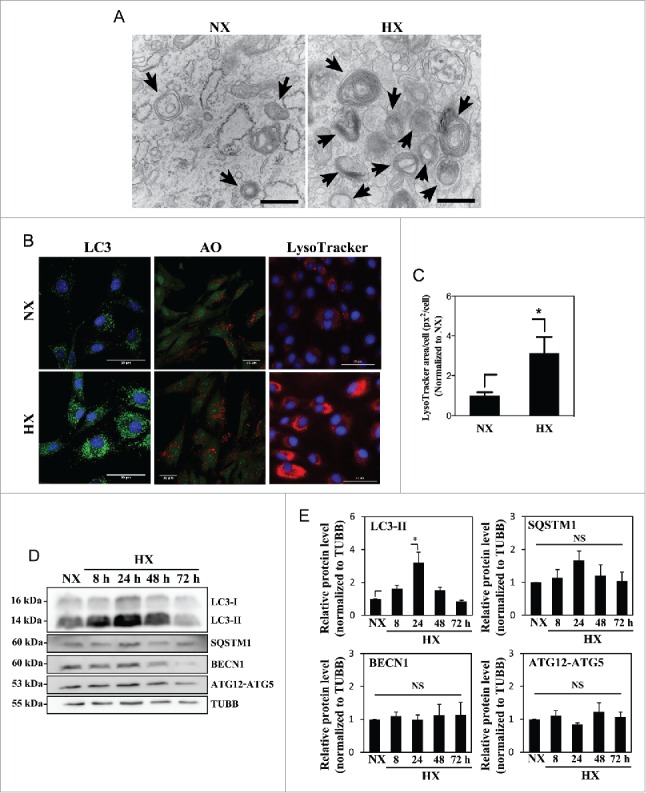
Hypoxia increases the number of acidic puncta and autophagosomes in nucleus pulposus (NP) cells. (A) Transmission electron microscopy images of primary NP cells cultured under normoxia (NX, 21% pO2) or hypoxia (HX, 1% pO2) for 24 h show multiple double-membrane enclosed autophagosomes (arrow); an increased number in hypoxia is observed. Scale bar: 500 nm. (B) Left panel: Immunofluorescence image of endogenous LC3 in NP cells shows increased LC3 puncta following 24 h in hypoxia. Scale bar: 50 μm. Middle panel: Acridine orange staining of NP cells shows cells cultured for 24 h in hypoxia have more acidic organelles (red signal). Scale bar: 35 μm. Right panel: LysoTracker® Red DND-99 staining of NP cells shows increased red staining after 24 h hypoxic culture. Scale bar: 50 μm. (C) Quantification of LysoTracker staining (red) as puncta area (px2)/cell using ImageJ software confirms increased acidic organelles under hypoxia. At least 427 cells per group were used for quantification analysis. (D) Western blot analysis of NP cells cultured under hypoxia for 8–72 h demonstrates accumulation of LC3-II protein at 8–48 h in hypoxia. (E) Densitometric analysis of multiple independent experiments as shown in the western blot confirms significant accumulation of LC3-II at 24 h hypoxia with an upward trend at both 8 and 48 h. Densitometric analysis of other autophagy-related proteins indicates that hypoxia does not influence levels of SQSTM1, BECN1, or the ATG12–ATG5 complex. Values shown are mean ± SE from at least 3 independent experiments. NS, nonsignificant; *, p < 0.05.