Figure 1.
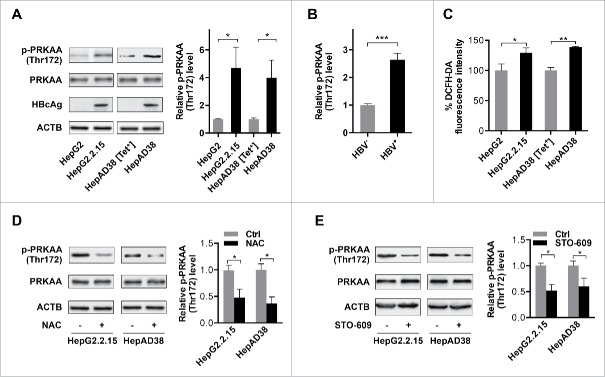
PRKAA is activated in response to HBV-induced ROS accumulation. (A) HepAD38 cells were grown with tetracycline (Tet+) or without tetracycline for 10 d. Control cells (HepG2 or HepAD38 [Tet+] cells), and HBV-producing cells (HepG2.2.15 or HepAD38 cells) were lysed and analyzed by immunoblot with the indicated antibodies. Relative intensity of the band was quantified by normalization to PRKAA using ImageJ software. p-, phosphorylated. (B) The phosphorylation levels of PRKAA (Thr172) in HBV-infected (HBV+) and HBV noninfected (HBV−) liver samples were determined by immunoblot. Densitometry quantification of the band intensities in Fig. S2 was carried out using ImageJ software and was shown as a percentage of relative densitometry normalized to ACTB. The mean ± SD densities were displayed in relation to HBV noninfected (HBV−) tissues. (C) The ROS level was monitored with an oxidant-sensitive fluorescent probe, DCFH-DA. Data were shown as mean ± SD of 3 independent experiments. (D) Cells were mock-treated or treated with NAC (10 mM) for 2 h followed by immunoblot analysis. (E) Cells were treated with DMSO or STO-609 (10 μg/mL) for 2 h followed by immunoblot analysis. Relative intensity of the indicated protein bands was quantified by normalization to PRKAA using ImageJ software. *, p < 0.05; **, p < 0.01.

