
Figure 4.
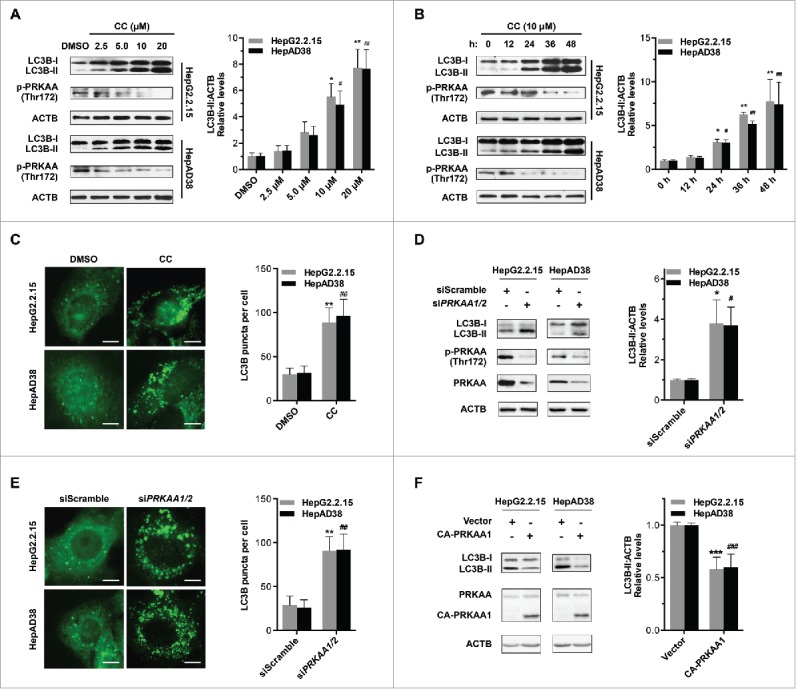
Inhibition of PRKAA contributes to autophagosome accumulation. (A) HepG2.2.15 or HepAD38 cells were treated with different concentrations of CC (0, 2.5, 5.0, 10, 20 μM) for 24 h, and cell lysates were subjected to immunoblot assay. (B) HepG2.2.15 or HepAD38 cells were treated with DMSO or 10 μM CC as indicated (0, 12, 24, 36 and 48 h) and subjected to immunoblot assay. (C) Immunofluorescence analysis of LC3B puncta in cells that were treated with DMSO or CC (10 μM) for 24 h. (D) Immunoblot analysis of total protein extracts from HepG2.2.15 and HepAD38 cells transfected with siScramble or siPRKAA1/2 for 48 h, respectively. Relative intensity of LC3B-II was quantified by normalization to ACTB using ImageJ software. (E) Immunofluorescence analysis of LC3B puncta in cells that were transfected with siScramble, or siPRKAA1/2 for 48 h. The number of LC3B puncta (mean ± SD) was quantified by ImageJ software. Values are means ± SD (n = 30). (F) Immunoblot analysis of total protein extracts from HepG2.2.15 and HepAD38 cells transfected with vector or plasmid encoding CA-PRKAA1 for 48 h. Relative intensity of LC3B-II was quantified by normalization to ACTB using ImageJ software. *, p < 0.05; **, p < 0.01; ***, p < 0.001 (in HepG2.2.15); #, p < 0.05; ##, p < 0.01; ###, p < 0.001 (in HepAD38). Scale bar: 10 μm.