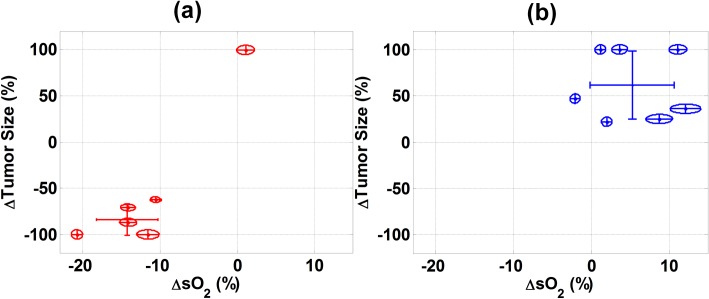
Fig 5. Size and oxygenation relationships.
Correlation between the changes in the size of the tumor treated with (a) HT-HaT-DOX and (b) HT-Saline at endpoint (from day 0) and the changes in mean sO2 between the values observed for 30 min pre-treatment and 2 h post-treatment. Each point is the average of 21 sO2 histograms at the 2 h timepoint. The major and minor axes of each ellipse represent the standard deviations of the change in sO2 and change in tumor size, respectively. † identifies a datapoint for a HT-HaT-DOX treatment that did not show regression, nor a characteristic drop in sO2 at 2 h post-treatment.

