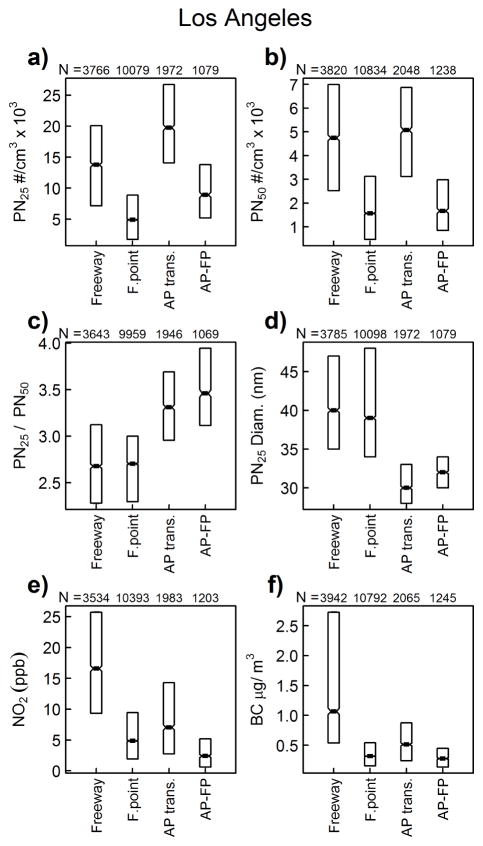
Figure 3.
Boxplots of the 25th, 50th, and 75th percentiles for select pollutants measured within the data designations defined in Figure 1 for LA. Abbreviations: F.point (fuzzy point), AP trans. (airport transect), AP-FP (airport fuzzy point). Pollutant concentrations are incremental departures from the 5th percentile, except for PN25/PN50 ratio and particle size data which are determined from the original (unaligned) data (see data adjustment in methods). Number of 10 s observations contributing to each boxplot is listed above each figure. Notches are +/−1.58(interquartile-range)/sqrt(n), and provide an approximate 95% confidence that two medians differ if the notches do not overlap.

