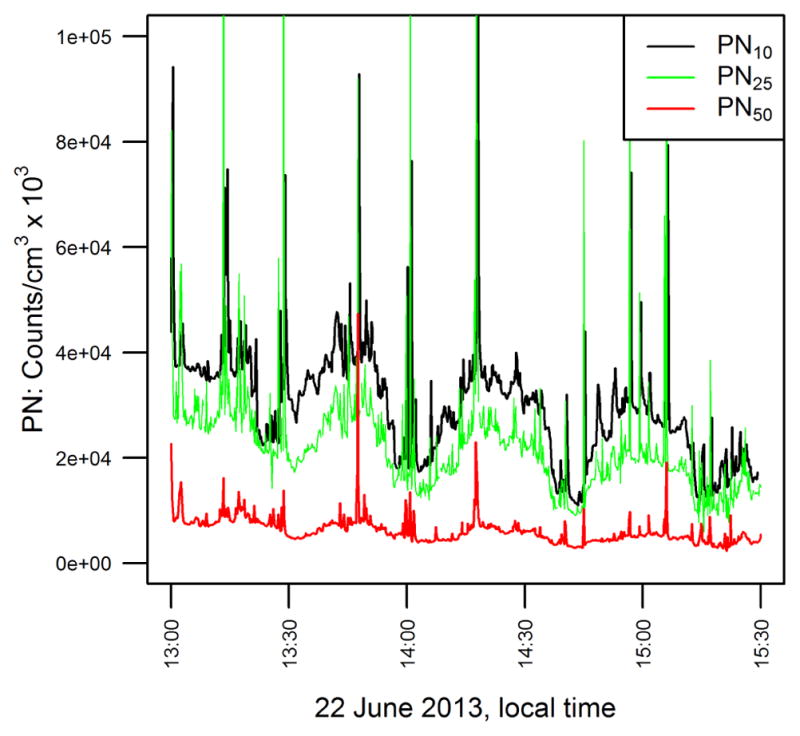
Figure 5.

Time series of unadjusted data during the airport transect sampling on June 22, 2013. An additional particle counter was included on this day with a lower size limit of detection of 10 nm and was only operated for the airport transect (black line).
