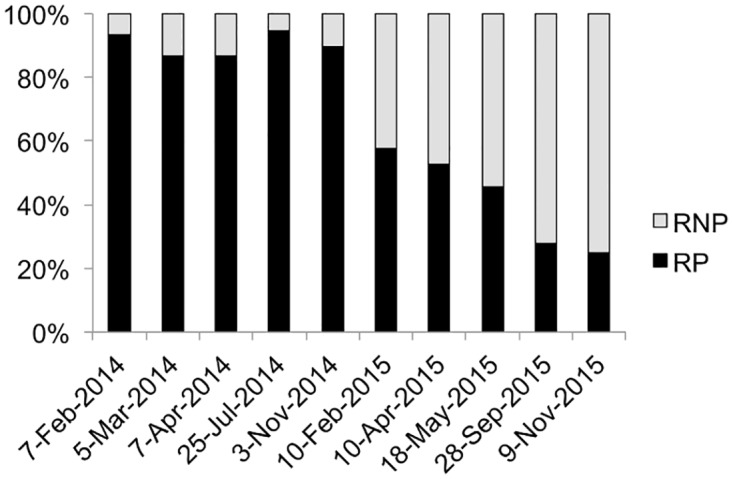
Fig 2. Proportion of resistant producer (RP) and resistant non-producer (RNP) lines over the course of the study.

Percentage of RP and RNP in resistant lines on the ordinate and date when virus production test was performed on the abscissa.

Percentage of RP and RNP in resistant lines on the ordinate and date when virus production test was performed on the abscissa.