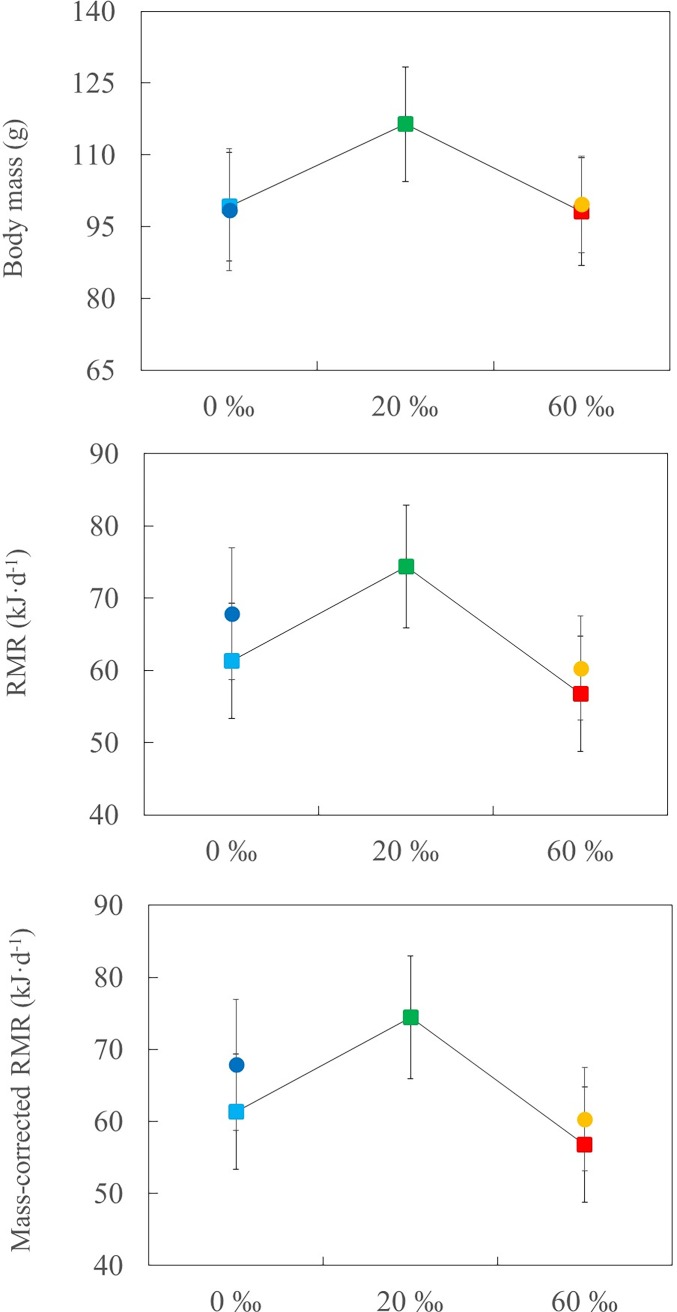
Fig 2. Resting metabolic rate (RMR) and body mass responses in relation to salinity levels.
Body mass, whole RMR, and mass-corrected RMR of captive-reared chicks at 0 (n = 9), 20 (n = 8), and 60 ‰ (n = 9) salinity (squares), and wild fledglings from hypersaline pans (n = 8) and freshwater reservoirs (n = 5; circles) (means ± SE). Whole RMR and mass-corrected RMR are presented as least square and adjusted means from the respective ANOVA and ANCOVA models. Data subject to log-transformation are shown as back-log-transformed least-square means. There were no significant differences among treatments (see text for further details).

