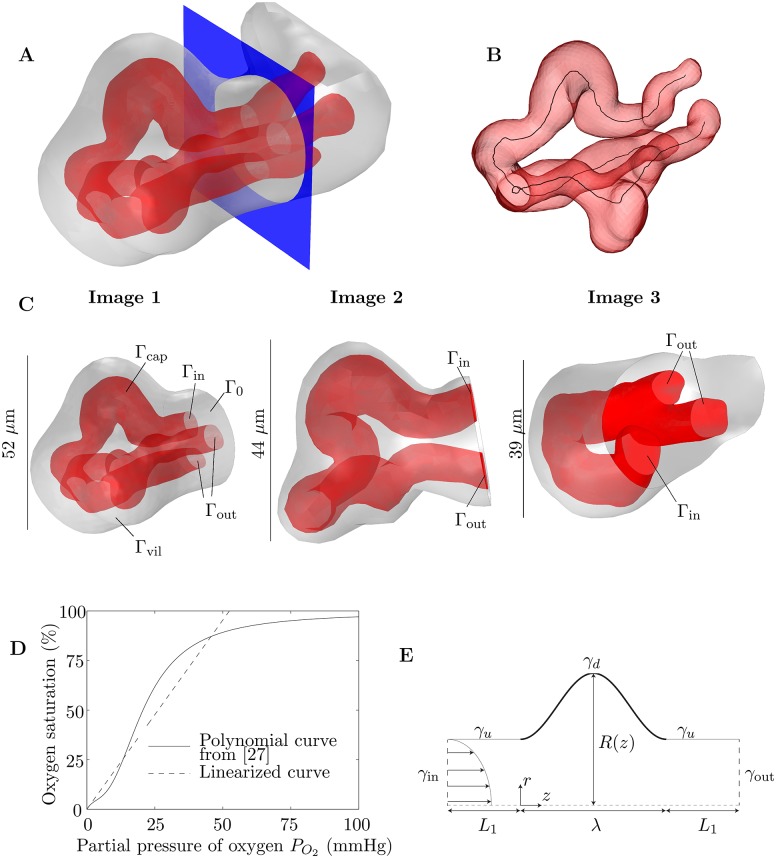
Fig 1. Methods.
(A) An example of how 3D images are partitioned with a plane (shown in blue) to provide a surface for boundary conditions to be applied. The red surface represents the capillary surface (endothelium, Γcap) and the grey surface represents the villous surface Γvil. In this example the capillary bifurcates within the villous branch. (B) Example of the skeletonization of a capillary from a 3D image. The skeletonization line, representing the centreline of the lumen, is shown in black. (C) The 3D images of fetal capillaries and villous surfaces used in the simulations (see S1 Images). The images shown have been partitioned by a plane on which boundary conditions are applied, for inflow (Γin), outflow (Γout) and villous tissue (Γ0). (D) Polynomial fetal oxygen–hemoglobin dissociation law from [27] (solid line) and the linear approximation between 0 and 60 mmHg, passing through the origin, found using a least-squares fit (dashed line). The gradient of the linear approximation is K = 0.019 mmHg−1. (E) Schematic diagram of the idealized axisymmetric model of a fetal capillary dilation, showing an axisymmetric tube with a localized dilation. Blood flows into the capillary through γin and leaves through γout. Oxygen is provided along the dilated section of the capillary γd, denoted by the thicker black line. The undilated sections of the capillary are labeled γu.

