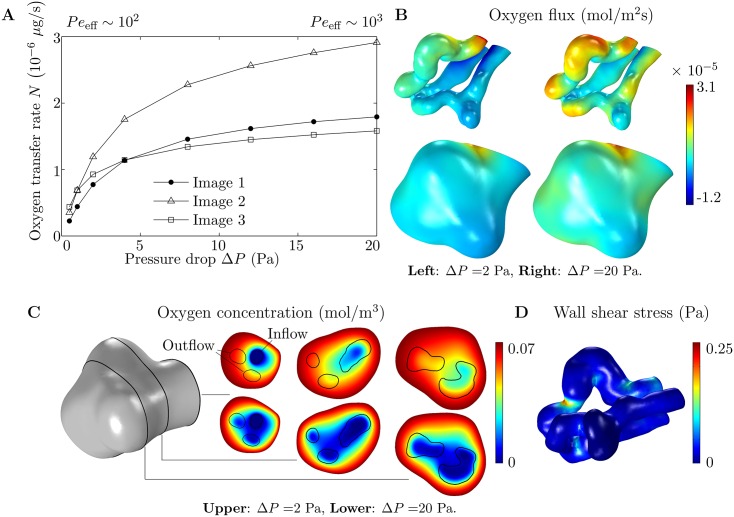
Fig 2. Results of numerical simulations on 3D geometries.
(A) Oxygen flux entering each capillary versus pressure drop ΔP. The range of values of ΔP is broadly physiological, leading to flow velocities of around 300 μm/s (Table 3), which is the approximate flow velocity in normal capillaries [36]. Peeff is in the range 102–103 as indicated. (B) Distribution of oxygen flux entering through the capillary (top) and villous (bottom) surfaces, from simulations on Image 1. Results are shown for ΔP = 2 Pa (left) and ΔP = 20 Pa (right). (C) Plots of the oxygen concentration field on three planes, 15 μm apart, from simulations on Image 1. The planes are shown on the villous surface on the left. Results are given for ΔP = 2 Pa (top) and ΔP = 20 Pa (bottom). Capillary walls are denoted by black lines. The inflow and outflow capillaries are labeled on the plane at the villous entrance (left). (D) Wall shear stress at the capillary surface, from a simulation on Image 1 (ΔP = 2 Pa).

