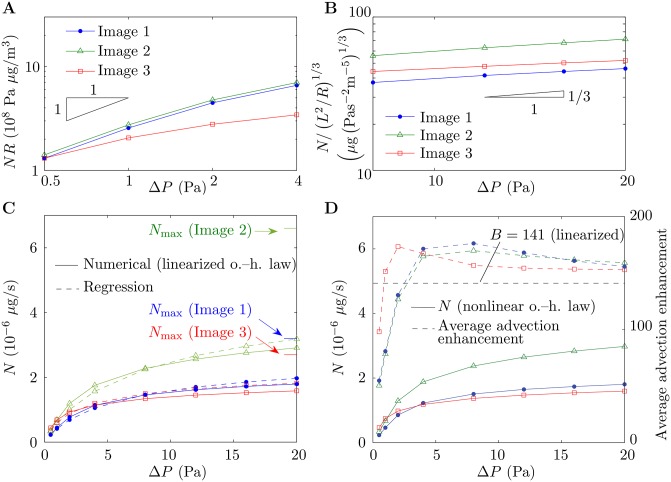
Fig 3. Scaling and regression.
Throughout the figure, results for Image 1, Image 2 and Image 3 are denoted by blue dots, green triangles and red squares, respectively. (A,B) Scaled oxygen transfer rate (A) NR and (B) N/(L2/R)1/3 versus pressure drop ΔP, on log-log axes. Solid lines denote numerical results and black triangles denote the gradients predicted by (A) scaling Eq (13) and (B) scaling Eq (12). (C) Oxygen transfer rate N versus ΔP with the linearized oxygen–hemoglobin dissociation law. Solid lines denote numerical results and dashed lines denote results generated by the regression Eq (19). The upper bounds Nmax on N are indicated, which have been calculated by solving the diffusion equation in the surrounding villous volume with the capillary assumed to be deoxygenated. (D) Oxygen transfer rate N with the nonlinear oxygen–hemoglobin dissociation law (solid lines) and average advection enhancement in each capillary (dashed lines) versus ΔP. Also shown on the figure is the oxygen advection enhancement parameter B (black dashed line), derived by linearizing the oxygen–hemoglobin dissociation law.

