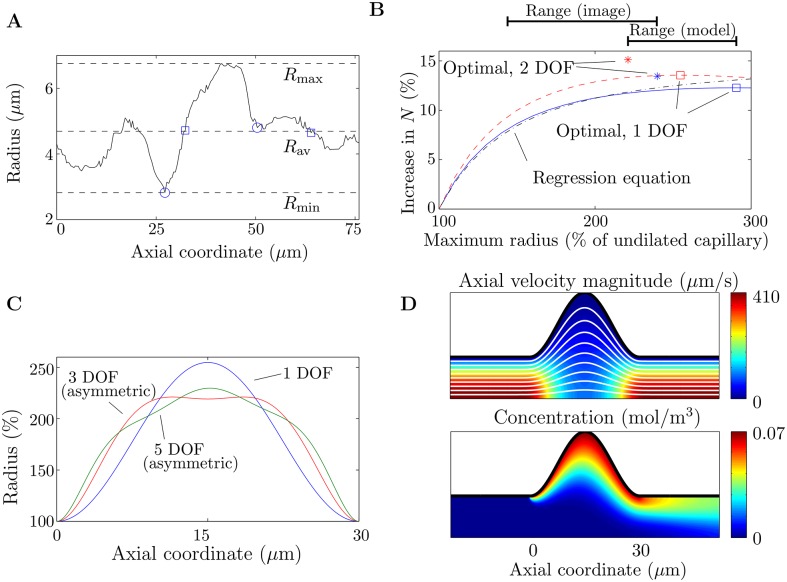
Fig 4. Results from the idealized axisymmetric model of a fetal capillary dilation.
(A) Radius of the capillary (of length L = 76 μm) in Image 1 before it branches, showing the dilation and the different ways used to define its length λ. Local minima are denoted with circles (this is subjective due to noise in the data). Points where the radius of the dilation equals the average radius are denoted with squares. The dashed lines show the minimum radius Rmin = 2.8 μm, the average radius Rav = 4.7 μm and the maximum radius Rmax = 6.8 μm. (B) Increase in oxygen transfer rate for a capillary dilation compared to a straight capillary. Included in the figure are results for shapes with 1 degree of freedom (DOF), with the undilated radius being Rmin (λ = 23 μm, Peeff = 285; blue solid line) and Rav (λ = 31 μm, Peeff = 475; red dashed line). Indicated on the figure are the maximum radius and the increase in the oxygen transfer rate N for the optimal shapes in each case with 1 DOF (squares) and 2 DOF (stars). The black dash-dotted line shows the predictions of the regression Eq (15), for a capillary dilation with 1 DOF, with the undilated radius defined as Rav. (C) Optimal shapes for successively increasing DOF. Where the shapes are asymmetric about the axial midpoint of the dilation, this is labeled on the figure. The shapes correspond to the case where the undilated radius of the capillary is defined as Rav, and are plotted as a percentage of the undilated radius. (D) Top: Axial velocity magnitude, with streamlines in white. Bottom: Concentration. Results are shown for the optimal dilation with 1 DOF, in the case where the undilated radius is taken to be Rav. It has been assumed that the centreline flow velocity in a straight capillary is equal to 300 μm/s.

