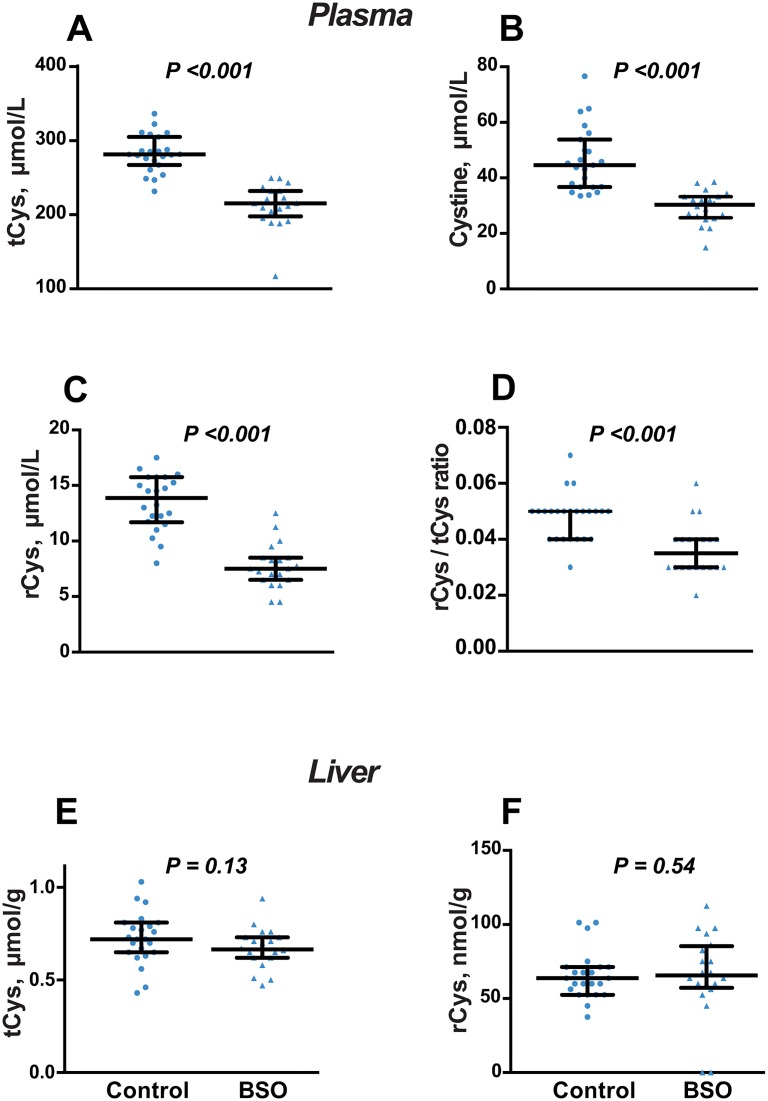
Fig 5. Effect of BSO on cysteine after 8 weeks of treatment.
A-D: Plasma total cysteine (tCys), reduced cysteine (rCys), cystine, and rCys/tCys ratio. E, F: Liver tCys and rCys. Data is presented as median, 25th and 75th percentiles, with individual data plotted; N = 20 (BSO) and N = 23 (controls). Groups were compared by Mann-Whitney U test.

