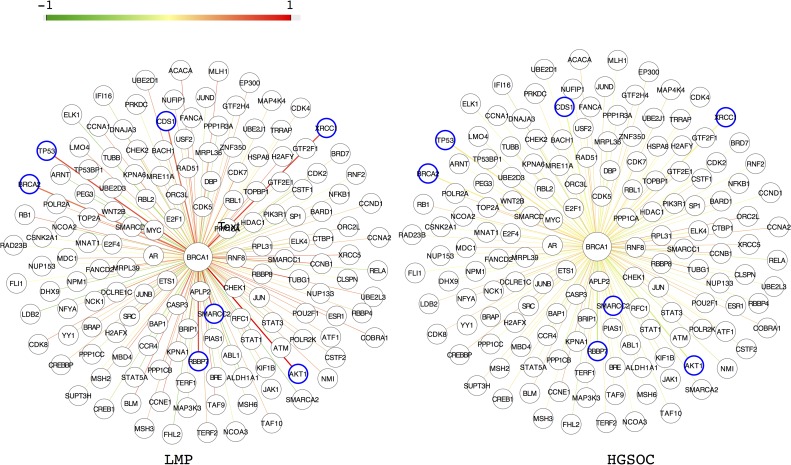
Fig 4. Pearson correlation coefficients (PCCs) for expression levels of BRCA1 and interaction partners in low-malignant-potential (LMP) and high-grade serous carcinoma (HGSOC) samples.
The color of an edge represents the value of the PCC for the genes that it connects. Blue circles indicate genes whose expression levels are highly correlated with BRCA1 expression levels in LMP, but not in HGSOC.

