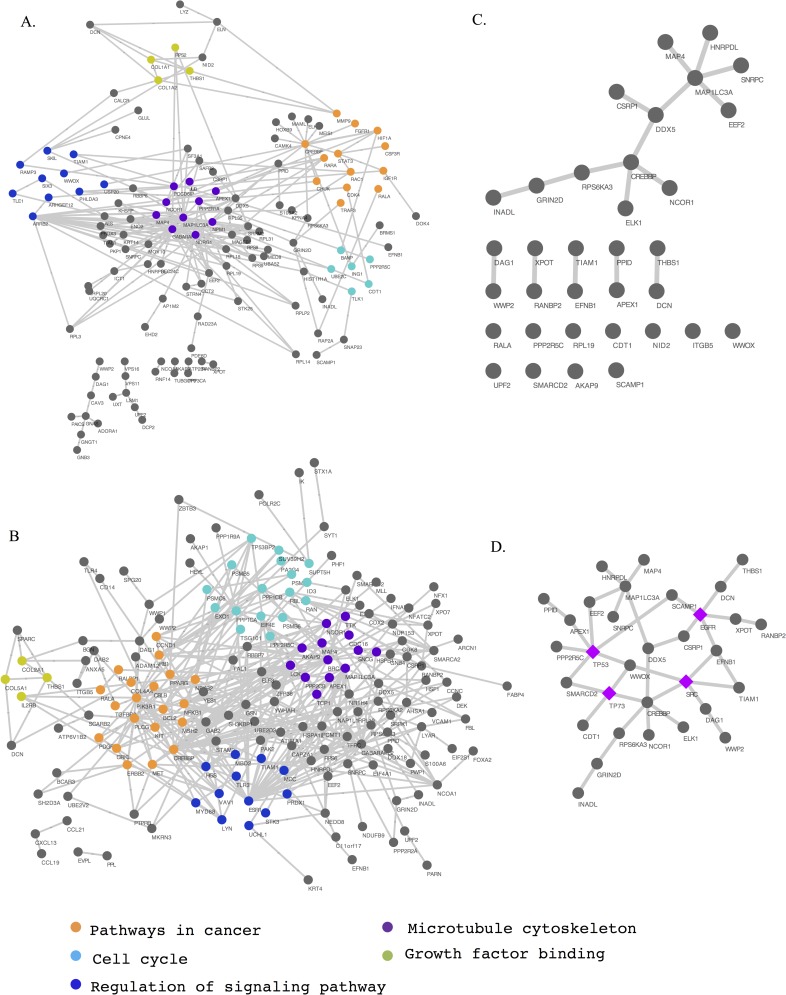
Fig 5. An overarching network connecting hub proteins differentially involved in low-malignant-potential (LMP) and high-grade serous carcinoma (HGSOC) samples.
Nodes and edges illustrate the network diagrams of GEO data sets (A) GSE17308 and (B) GSE9891. Each functional complex is represented by a different color. (C) There are 34 hubs that overlap between the two data sets. (D) Additional gene products, highlighted in purple, have the largest number of connections to the 34 concordant hubs, interconnecting all of the hubs except for six orphans.

