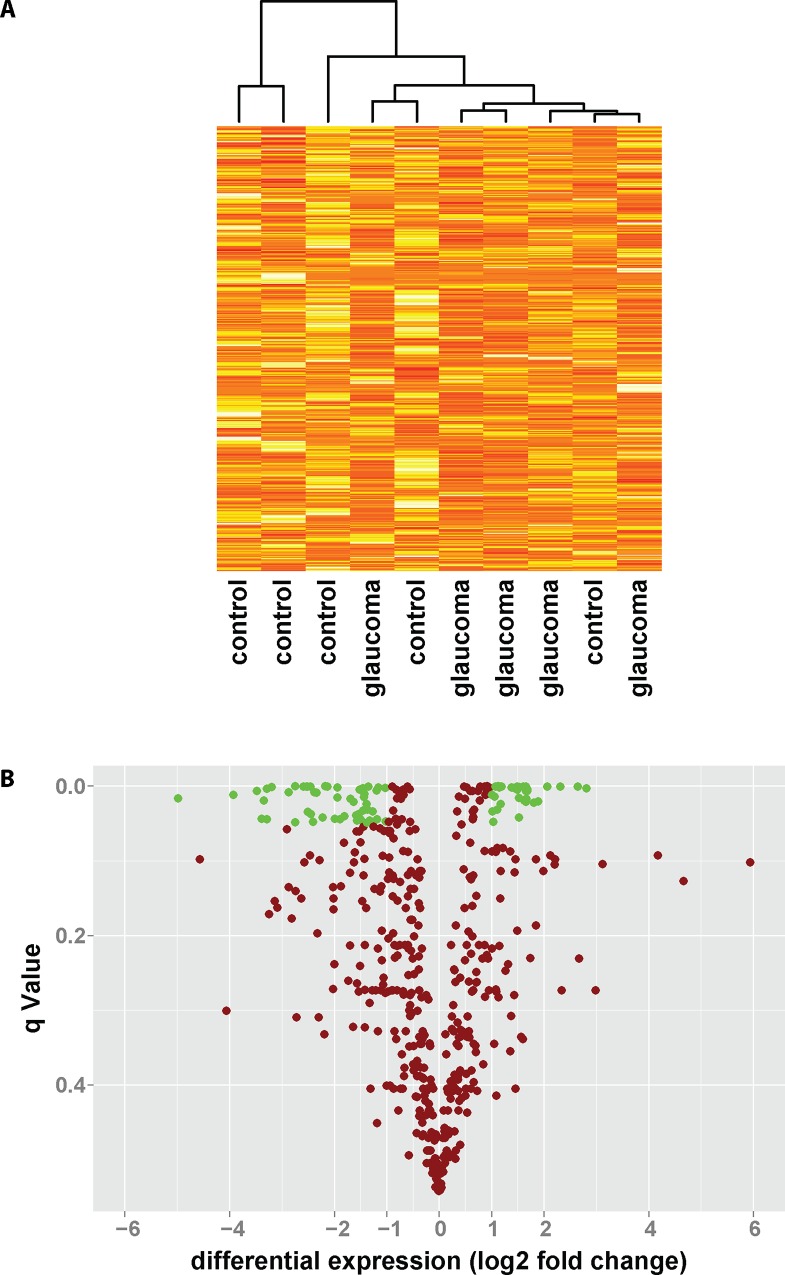
Fig 1. Comparing the aqueous humor proteome of glaucoma patients to controls.
The proteome of aqueous humor samples obtained from POAG patients or control subjects undergoing cataract surgery was determined using quantitative hyper reaction monitoring mass spectrometry with SWATH technology. (A) Cluster analysis of glaucoma patients and controls based on the expression level of 448 proteins in aqueous humor. (B) Of 448 proteins measured, 53 proteins showed significant downregulation, while 34 proteins showed significant upregulation in the aqueous humor of glaucoma patients compared to controls. Shown is the differential expression in log2 fold change against the significance level of the false discovery rate test (q-value).

