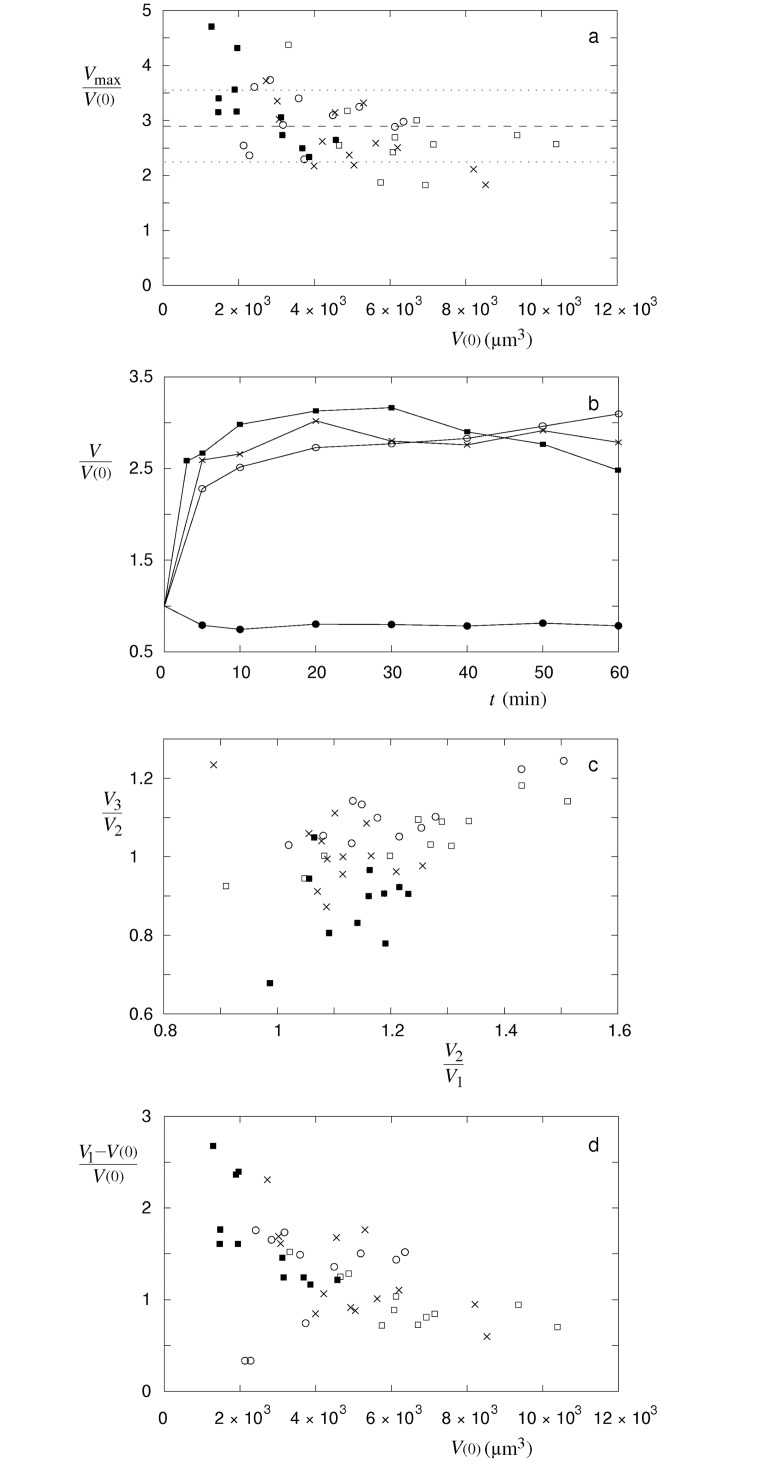
Fig 3. Maximal volumes of single cells, characteristic time behavior patterns of the cell volume changes and ratios between the cell volumes at different phases of the measurement.
(a) Maximal volumes of single cells (Vmax) relative to their volumes before the treatment (V(0)) at 150 (○, n = 11), 300 (□, n = 11), 400 (×, n = 13) and 600 (■, n = 11) μmol/L nystatin concentration. Average value (dashed line) of single cell measurements and standard deviation (dotted lines) are shown. (b) Three characteristic time behavior patterns of volume changes in cells treated by nystatin: “type A” (○), “type B” (×) and “type C” (■). The patterns for single cells with their maximum values closest to 2.9 are presented. As a control, a characteristic behaviour of “methanol only” treated cell at 6% volume fraction is shown (●). The lines are drawn only as a guide to the eye. (c) Ratios between the cell volume at the end of the measurement and in its middle phase (V3/V2) versus ratios between the cell volumes in the middle and in the beginning phase of the measurement (V2/V1) for the same cells as in (a). The volumes at different phases are defined through the expressions V1 = [2V(5 min) + V(10 min)]/3, V2 = [V(20 min) + 2V(30 min) + V(40 min)]/4 and V3 = [V(50 min) + 2V(60 min)]/3. (d) Ratios between the increases of single cell volumes in the beginning of the measurement and their volumes before the treatment ((V1-V(0))/V(0)) versus their volumes before the treatment for the same cells as in (a).

