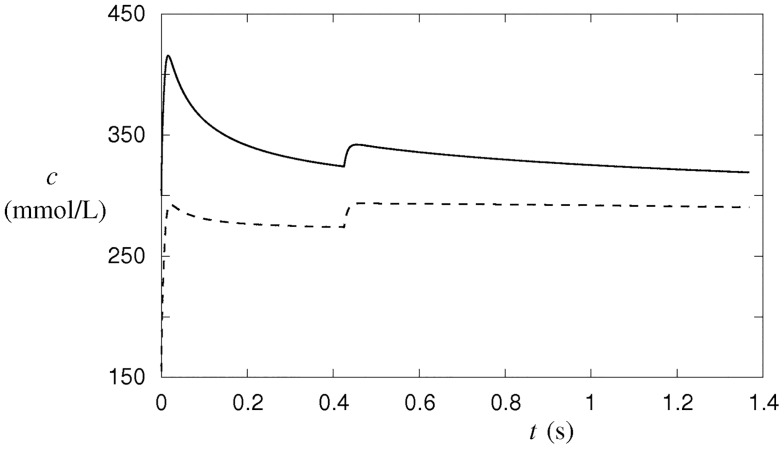
Fig 7. Concentration and osmolarity changes in the cell after the formation of 9 × 10⁷ nystatin pores with a 0.45-nm radius.
The cellular osmolarity is depicted by full line and the sum of the cellular osmolarities (concentrations) of the most abundant ions by dashed line. The changes were predicted by the numerical procedure according to the model (S1 File).

