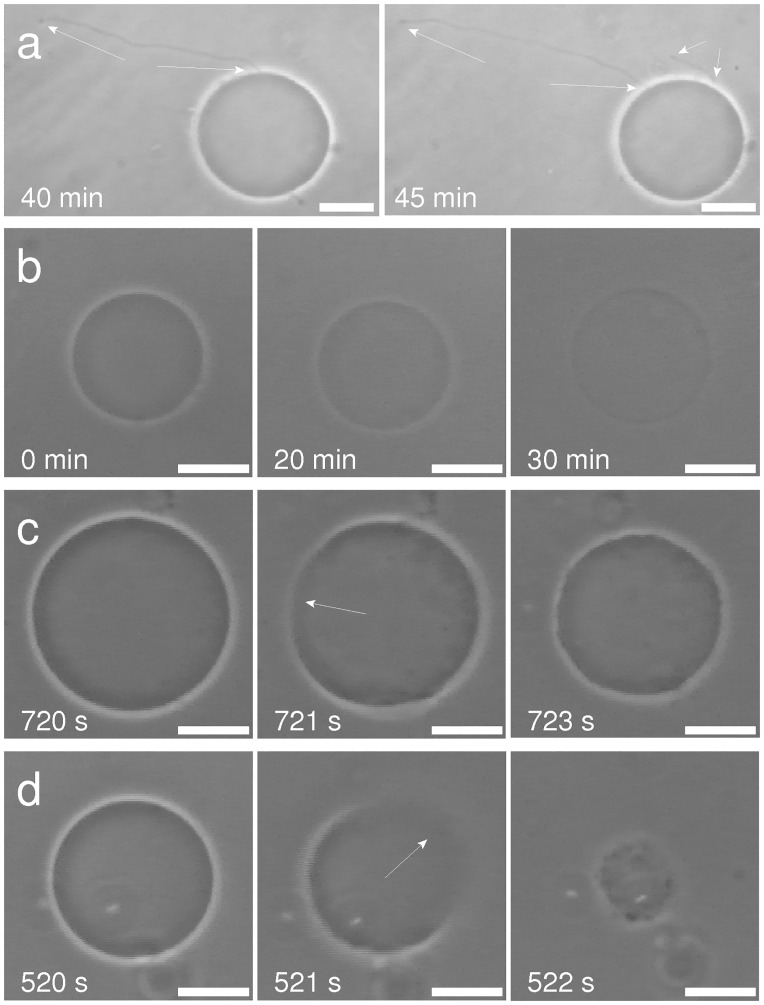
Fig 10. Characteristic behavior of GUVs at different nystatin concentrations.
The GUVs show different behavior due to the pore-formation process in vesicles with smaller glucose molecules outside and larger sucrose molecules inside, as seen using phase-contrast microscopy [26]. Development of typical membrane protrusions (indicated by arrows) due to the nystatin binding to the outer membrane monolayer at low nystatin concentrations (a). Loss of vesicle contrast due to transient tension pores at intermediate nystatin concentrations (b). Slow (c) and fast (d) vesicle ruptures at high nystatin concentrations: GUVs before the rupture (left), during the rupture (middle, tension pore indicated by arrow), and immediately after the rupture (right) are shown. The times after the GUV transfer into the nystatin solution are depicted on the images. The bars represent 20 μm. For more detailed descriptions see Refs. [26] and [29].

