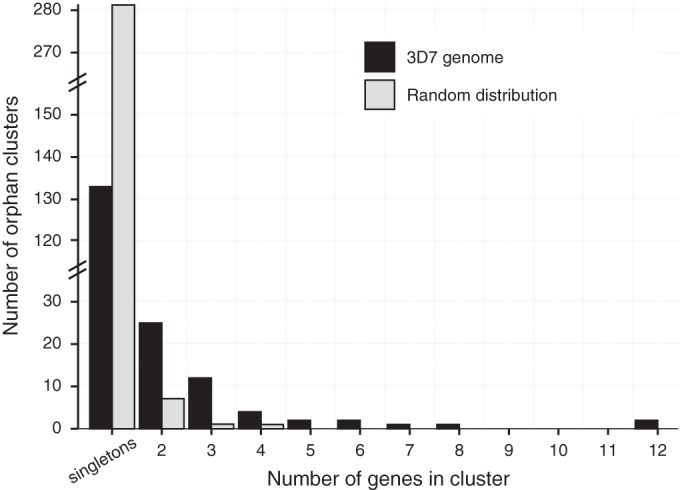
FIG 3 .

Clustering of orphan genes in the genome. The number of genes per orphan cluster is shown in comparison to the mean cluster size drawn from 1,000 randomly drawn distributions. Orphan genes were significantly more clustered than expected by chance (Fisher exact test, P < 0.0001). Standard errors from the randomly sampled orphan gene distributions were too small for visualization.
