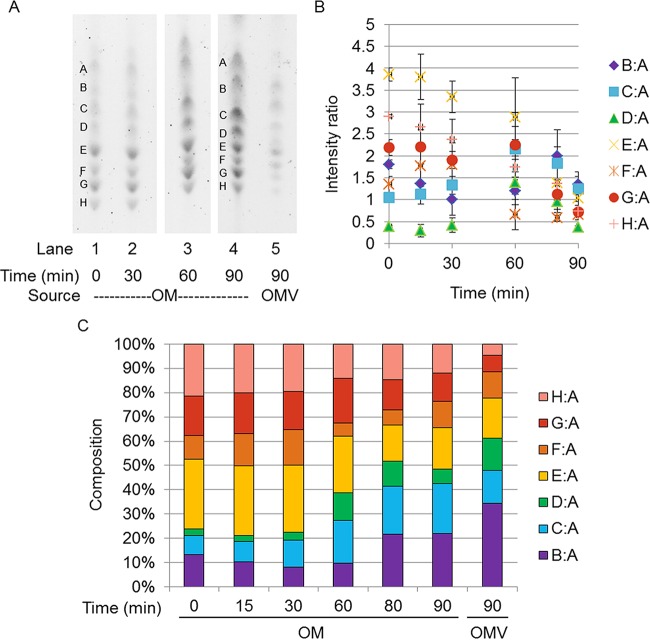
FIG 5 .
Comparison of OM and OMV lipid A compositions under the 5.8L-to-7.6H condition. (A) Representative TLC separation of lipid A from WC time points (OM) and OMVs from the 5.8L-to-7.6H condition. (B) Values of the ratios derived from densitometric quantification of the bands present in TLC separations. All ratios are in reference to band A. (C) Representation of the densitometric ratios as percentages of the total composition. The ratios presented in panel B are percentages of the total sum of all of the ratios present per time point. The standard errors of the composition measurements at the different time points are shown in Fig. S6D in the supplemental material.

