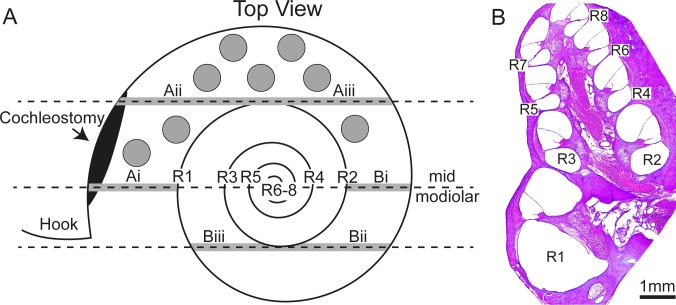
Fig 1. Schematic illustration of the top view looking down on the cochlea depicting the approximate location where the SPs were implanted (grey circles).
The cochlear regions that were analysed for SGN density (region 1 to region 8; R1-R8) and tissue response to implantation (grey region on dotted lines–Ai-iii and Bi-iii) are shown. Tissue response data was averaged across region A and B. (B) A mid modiolar micrograph of an implanted cochlea showing the cochlear regions in which SGN density within Rosenthal’s canal was analysed (R1-R8).

