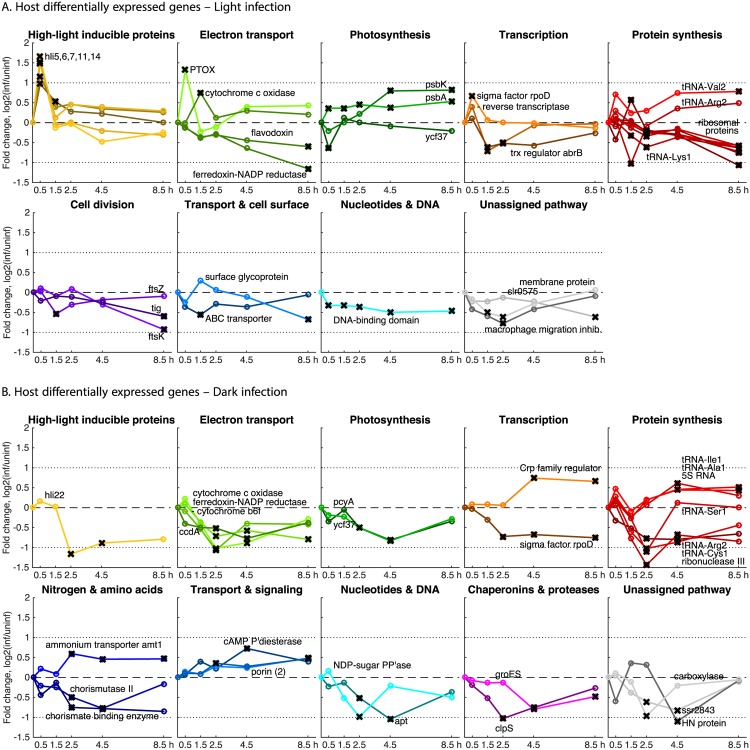
Fig 3. Host differentially expressed genes (DEGs) following infection in the light and dark, organized by pathway.
Genes shown were differentially expressed at one or more time point, marked with a black ‘X’ if NOISeq probability q > 0.95, and match those in S3 Table. Line color shading is proportional to relative transcript abundance at 0.5 h post-inoculation. Two-fold changes up and down are indicated by dotted lines, and zero fold change is indicated by a dashed line.

