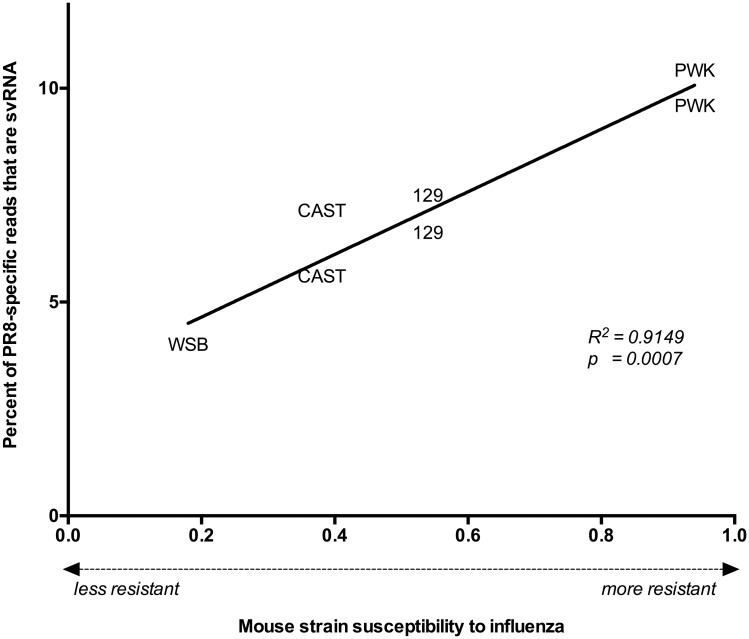
Fig 6. Relationship between host immunity and svRNA abundance.
For each infected mouse, the susceptibility of the mouse strain to influenza virus was plotted against the abundance of svRNA in the PR8 reads for that sample. Lower values indicate that the mouse strain is more susceptible to PR8 (high viral titer, inflammation and weight loss); higher values indicate that the mouse strain is more resistant to PR8 (low viral titer, little inflammation, and weight loss). Pearson’s linear correlation was applied to the dataset to quantify the relationship between the variables, and the line connecting the data points represents the linear regression of the data.

