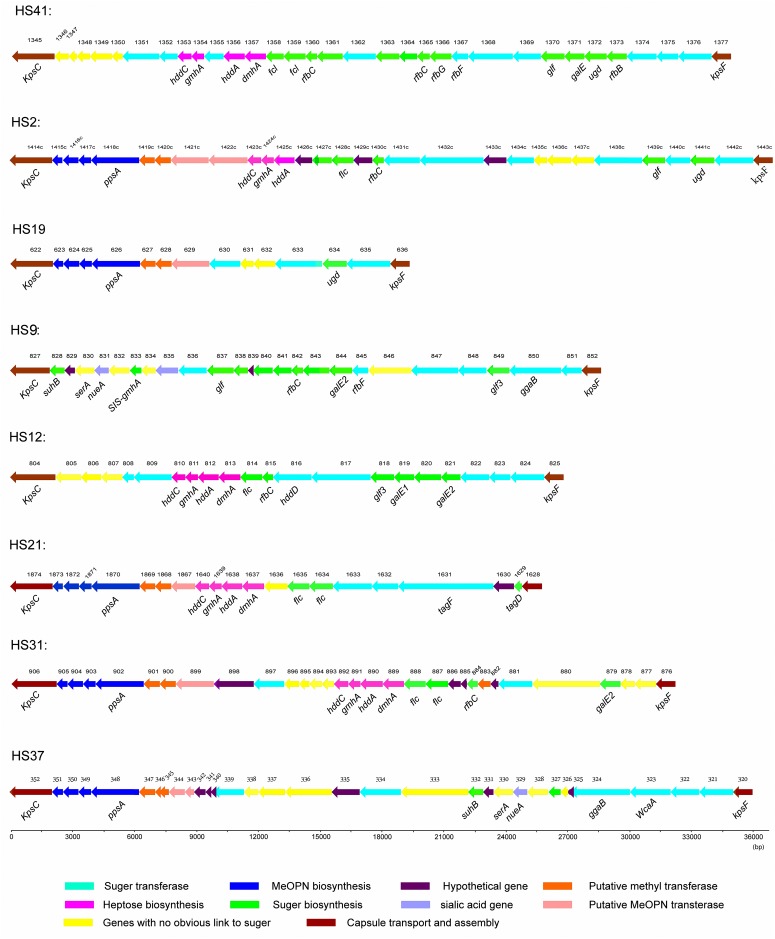
Fig 3. Schematic diagram of variable CPS loci from representative Penner serotypes.
Gene names were attributed if the predicted protein showed >80% sequence identity with other known C. jejuni proteins. Genes are color coded as shown in the key to the Fig on the basis of best homology to any predicted protein in databases by BLAST analyses.

