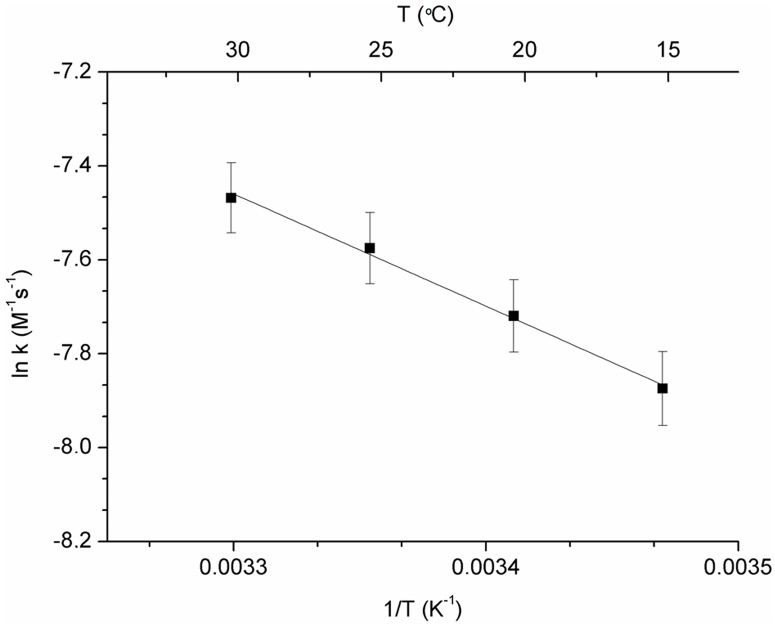
Fig 3. Arrhenius plot showing the linear correlation between the logarithm of the kinetic rate constant (ln k) and the inverse of temperature 1/T (ln k = ln A0—Ea/RT), R2 = 0.994).
The activation energy (Ea) and the pre-exponential factor (A0) were 19.9±0.9 kJ.mol-1 and 0.44±0.37 M-1.s-1, respectively. Uncertainty errors for ln k values are represented as error bars (percent of data: 1%).

