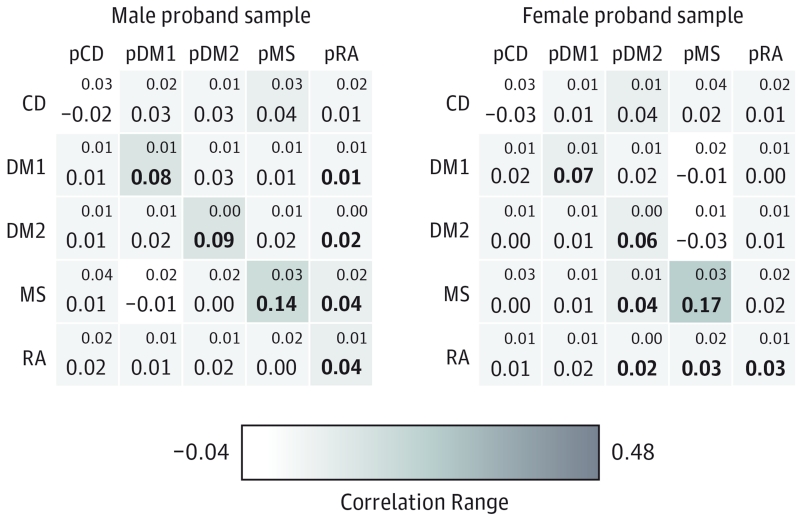
Figure 4. Within-Disorder and Cross-Disorder Partner Correlations, by Nonpsychiatric Proband Sex, in Restricted Case Samples.
The magnitude of the spousal correlations is reflected in the figure’s coloration, with darker boxes indicating stronger correlations between the diagnostic status of the relevant proband (indicated by row labels) and the corresponding diagnostic status of his or her mate (indicated by column labels). pXXX is the opposite-sex partner of a proband with diagnosis XXX. Large figures in each box reflect the correlation for that row or column, with small figures indicating the standard error. Large figures in bold indicate that the correlation is statistically significant (P < .001). Due to unique matched populations and the possibility of multiple pairings per individual, within-disorder correlations may be asymmetric for the same comparison depending on the proband sex. CD indicates Crohn’s disease; DM1, type I diabetes mellitus; DM2, type 2 diabetes mellitus; MS, multiple sclerosis; and RA, rheumatoid arthritis.

