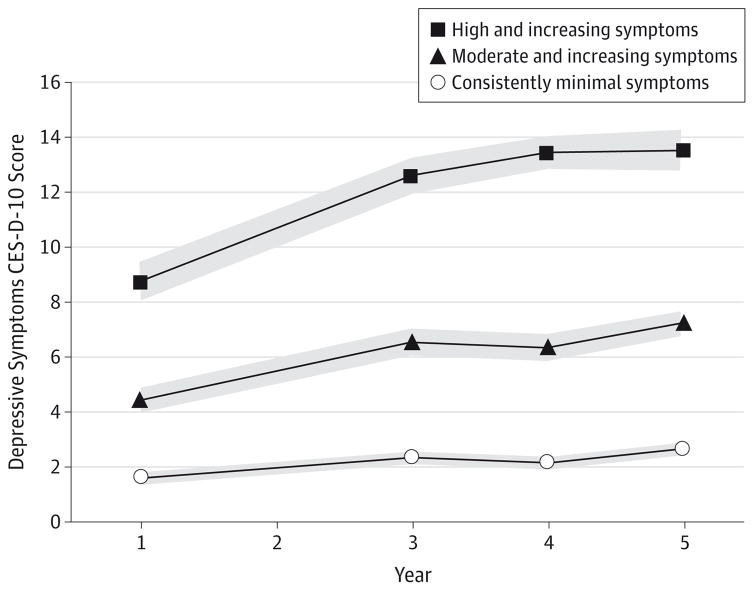
Figure 2. Depressive Symptom Trajectories From Baseline to Year 5 Among 2488 Older Adults.
Shown are results of the latent class growth curve analysis used to identify groups of individuals following a similar trajectory of depressive symptoms over time, as assessed with the Center for Epidemiologic Studies Depression Scale Short Form (CES-D-10) score at years 1, 3, 4, and 5. The 3 depressive symptom trajectories that were identified are shown with 95% CIs (gray shaded area).

