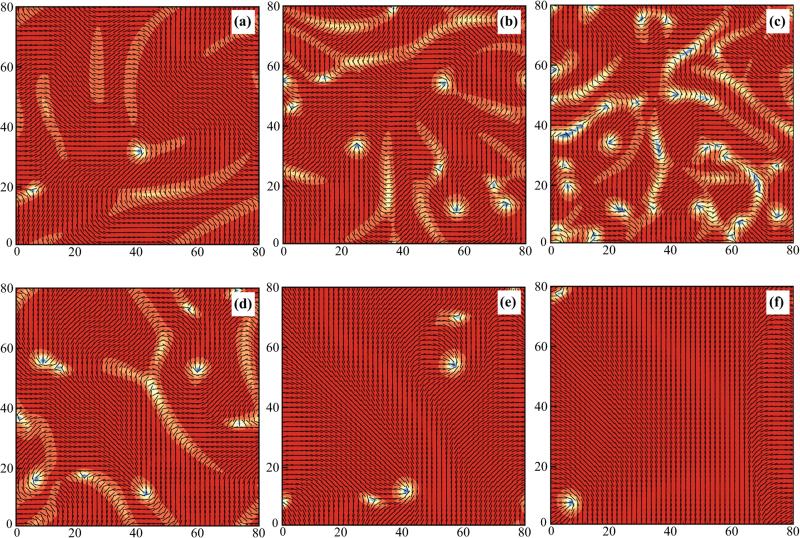
FIG. 10.
(Color online) Snapshots of motile defects when choosing different stress magnitudes. For plots in (a)–(c), α1 + α2 −2.0 is fixed: (a) α1 = −2.0 and α2 = 0; (b) α1 = −1.0 and α2 = −1.0; (c) α1 = 0 and α2 = −2.0. Panels (d)–(f) show time sequential snapshots (t = 0,100,300) of a case initially starting from the state with streaming defects but the fluid velocity field in turned off (U = 0). The system slowly relaxes to a globally nematic-aligned state. In (a)–(f), the color scale is the same as Fig. 5(b).

