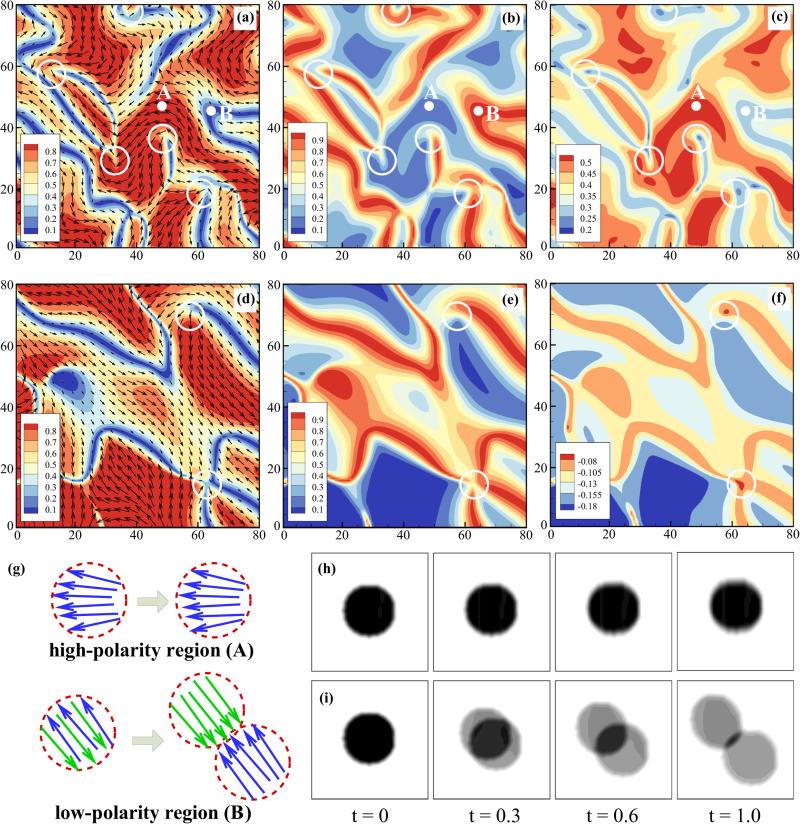
FIG. 7.
(Color online) Dynamics of the polarity field, the polarity-dependent active stresses, and the predicted dynamics of a photobleaching experiment. [(a)–(c)] Results from the simulation shown in Fig. 5. (a) The polarity vector field q superimposed upon its magnitude |q| (the local polar order). Circular areas labeled A and B mark regions of high and low polarity, respectively. [(b) and (c)] Polarity-dependent|active stress magnitudes, showing principal eigenvalues of the active stresses due to polarity sorting [Σaa (b)] and motor relaxation (Σpa, c). In (a)–(c), the stress magnitudes are chosen as αaa = −2.0 and αpa = −0.6. For comparison, (d)–(f) shows the polarity field and the polarity-dependent active stress fields when choosing αaa = −2.0 and αpa = 0.2. In (a)–(f), positions of +1/2-order defects are marked by open circles. (g) Schematic of predicted dynamics for a bleached spot of high nematic order in a region of high polar order (area A) and in a region of low polar order (area B). Arrows represent MTs with arrowheads denoting plus ends. In panels (h) and (i) these predictions are borne out by simulations of photobleached spots in areas A and B, respectively.

