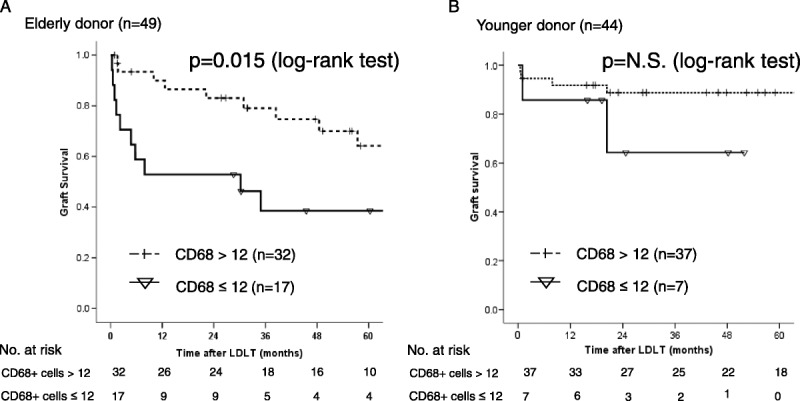
FIGURE 3.

A, A comparison of the graft survival in recipients with donors older than 50 years (n = 49) between those with more than and fewer than 12 CD68-positive cells. P = 0.015 (log-rank test), B, A comparison of the graft survival in recipients with younger donors (n = 44) between those with more than and fewer than 12 CD68-positive cells. N.S. (log-rank test).
