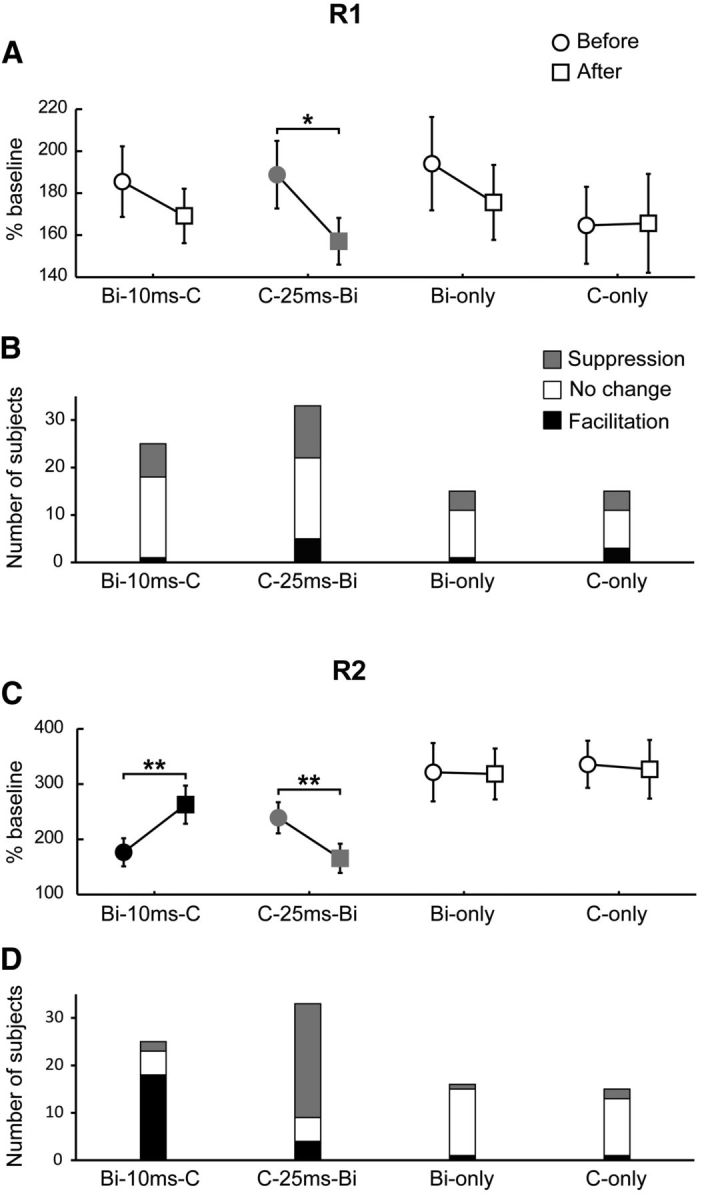
Figure 3.

Group results in the biceps muscle. A, C, Comparison of mean reflex size (expressed as a percentage of baseline EMG activity) before (circles) and after (squares) wearable device stimulation, for the four stimulation protocols illustrated in Figure 1C–F. *p < 0.05; **p < 0.005. B, D, Stacked bar plots showing the number of subjects with significant (p < 0.05) reflex facilitation (black), suppression (gray), or no change (white). A and B relate to the short-latency (R1) reflex component; C and D relate to the long-latency (R2) component. Bi-10ms-C, Biceps stimulation 10 ms before the click; C-25ms-Bi, click 25 ms before biceps stimulation; Bi-only, biceps stimulation alone; C-only, click stimulation alone. Error bars show standard errors of the mean.
