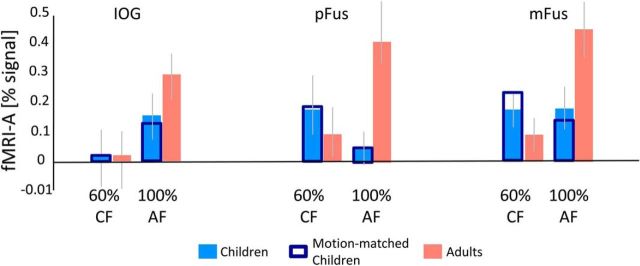
Figure 6.
fMRI-A in face-selective regions shows an own-age bias. fMRI-A for IDI-matched faces of 60% morphs of child faces (CF) and 100% adult faces (AF). Data are averaged across participants of each age group in each face-selective region. fMRI-A was measured as the signal difference between the condition of interest and blocks of identical child and adult faces, respectively. Orange, Mean fMRI-A in adults' face-selective regions averaged across 12 subjects in IOG, 12 subjects in pFus, and 12 subjects in mFus. Light blue, Mean fMRI-A in children's face-selective regions averaged across 17 subjects in IOG, 17 subjects in pFus, and 18 subjects in mFus. Dark Blue, Mean fMRI-A in the subset of 12 children motion-matched to adults. Error bars, SEM fMRI-A across participants of an age group.

