Figure 8.
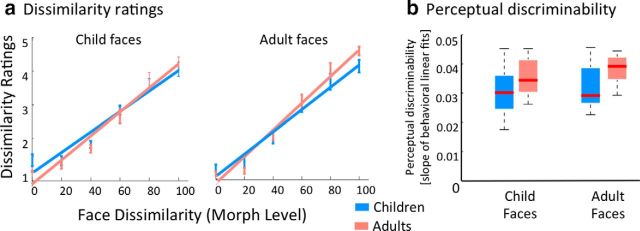
Perceptual dissimilarity ratings in children and adults. a, Perceptual dissimilarity ratings across age groups: measurements and linear fits of the behavioral ratings of face dissimilarity as a function of morph level, separately for child faces (left) and adult faces (right). Blue, Children; orange, adults. Linear fits are the group average of individual subject fits. Error bars, SEM averaged across participants of an age group. b, Perceptual discriminability across age groups: boxplots depicting median (red line), 25 and 75% percentiles (box edges), and range (dotted lines) of perceptual discriminability (slope of linear fit of dissimilarity ratings) in children (blue) and adults (orange). Adults have significantly higher perceptual discriminability than children across both face types (F(1,42) = 8.95, p < 0.01). In all plots, data are from 12 children and 11 adults.

