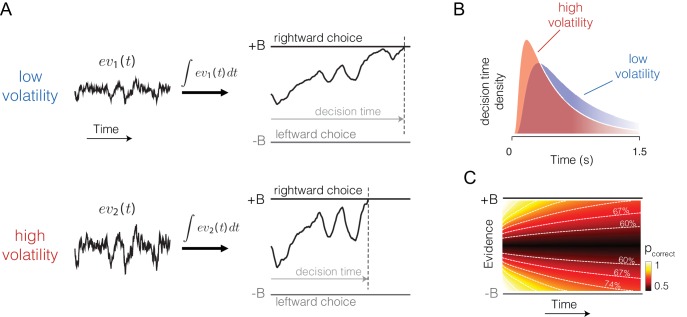
Figure 1. Predicted influence of volatility on reaction time and confidence under bounded evidence accumulation.
(A) ev1(t) and ev2(t) represent the time course of momentary evidence, for stimuli of low and high volatility, respectively. In bounded accumulation models, momentary evidence is integrated over time, until the accumulated evidence (decision variable, DV) crosses one of two bounds, here at ± B. Bound-crossing simultaneously resolves the choice that is made and the time it takes to make it (decision time; the reaction time also includes a nondecision component, not shown). With greater noise, the decision variable tends to diffuse more rapidly, leading to faster responses. (B) Illustration of the effect of volatility on the distribution of decision times, for two bounded accumulation models that have the same drifts and bound heights but different diffusion coefficients. As in the single trial example, higher variance leads to faster responses. (C) Heat map depicting the association between the state of accumulated evidence and the probability that a decision rendered on this evidence is correct. The structure in this graph arises because there are several difficulty levels. More reliable stimuli (e.g., high motion coherence), which support high accuracy, contribute to large vertical excursions of the decision variable away from the starting point (midpoint of the ordinate) at short elapsed time, whereas less reliable stimuli contribute to equivalent vertical excursions at later times. Example probability contours are depicted with dashed lines. Because the volatility of the stimulus is not explicitly represented in this map, higher volatility would lead to greater confidence, because the decision variable diffuses more quickly from the starting point, leading paradoxically to states that are normally associated with more reliable sources.

