. 2016 Oct 27;5:e17688. doi: 10.7554/eLife.17688

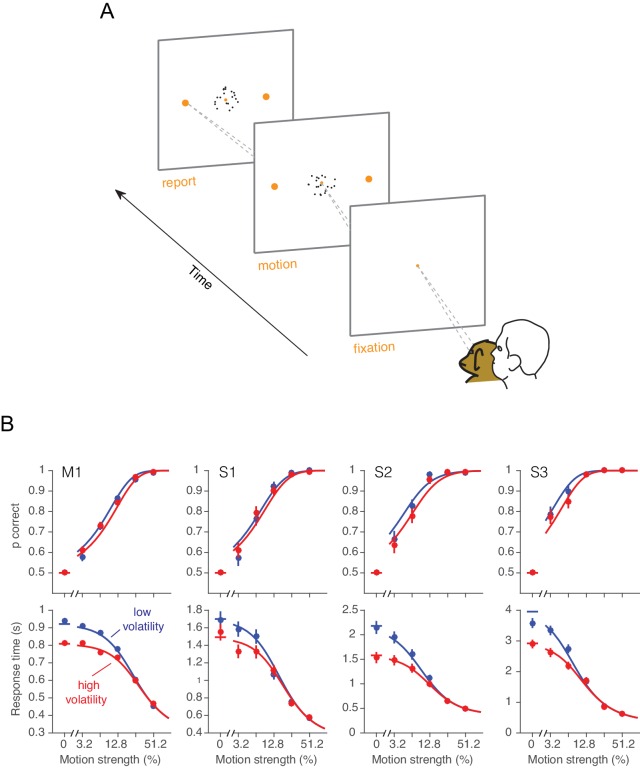
Figure 3. Effect of volatility on accuracy and reaction time.

(A) Choice-reaction time task. One monkey and three humans were required to make a decision about the net direction of motion in a dynamic random dot display. Subjects reported their decision by making a saccadic eye movement to the right (left) target for rightward (leftward) motion. They could report their decisions at any time after the onset of motion. Trials of different coherences and volatilities were randomly interleaved. (B) Decision speed and accuracy. Each column represents a different subject. High volatility had only weak effects on accuracy (upper) but shortened the reaction times for all subjects (lower), particularly at the low motion strengths. Symbols are mean ± s.e. Solid traces are fits of a bounded evidence accumulation (drift diffusion) model. (M1, monkey; S1-S3, human subjects).

DOI: http://dx.doi.org/10.7554/eLife.17688.008

Figure 3—source data 1. Accuracy and reaction times from the choice-reaction time task.
DOI: 10.7554/eLife.17688.009

Figure 3.

Figure 3—figure supplement 1. Accuracy in low and high volatility.

Figure 3—figure supplement 1.

Although the volatility manipulation led to only a subtle reduction in overall accuracy, which was not statistically reliable, we believe this is because the volatility manipulation was attenuated at intermediate and strong motion strengths (Figure 2). Nevertheless, a small reduction in accuracy is apparent when examining only these intermediate and higher coherences. (A) For the data from the RT task, the scatter plot shows the average accuracy for low vs. high volatility. Each point represents a particular combination of subject and motion strength. The 0% and 51.2% coherences are not shown. Errors bars represent s.e. (B) Same as A, but including trials from all experiments (RT, PDW and human confidence tasks).