. 2016 Oct 27;5:e17688. doi: 10.7554/eLife.17688

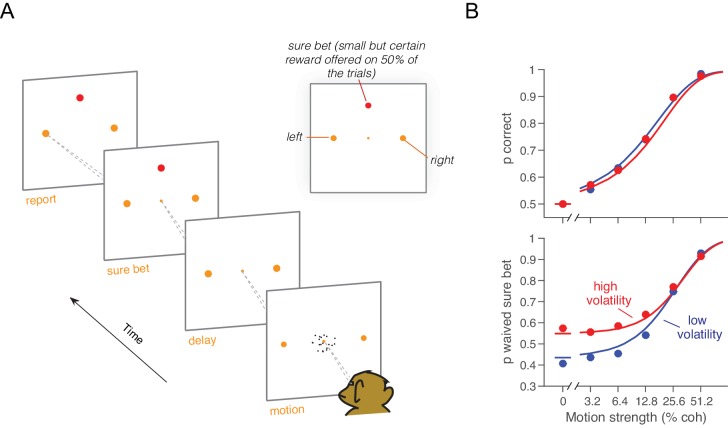
Figure 4. Effect of volatility on post-decision wagering.

(A) Task. The monkey viewed the motion display for random duration, controlled by the computer, followed by a memory-delay period. When the fixation point was extinguished, the monkey indicated the net direction of motion by making an eye movement to a left or right choice target in order to receive a liquid reward, if correct. On a random half of trials, the monkey was presented a third ‘sure bet’ option (red target) during the delay period, which if chosen resulted in a small but certain reward. (B) Decision confidence and accuracy. Volatility did not affect accuracy systematically (upper), but the monkey waived the sure bet option more often on trials employing the high volatility display (lower), indicating greater confidence. The effect was concentrated at weak and intermediate motion strengths. Standard errors are shown but are smaller than the symbols. Solid traces are model fits (see Materials and methods).

DOI: http://dx.doi.org/10.7554/eLife.17688.011

Figure 4—source data 1. Proportion of correct and waived direction choices as a function of motion strength and volatility condition in the PDW task.
DOI: 10.7554/eLife.17688.012

Figure 4.

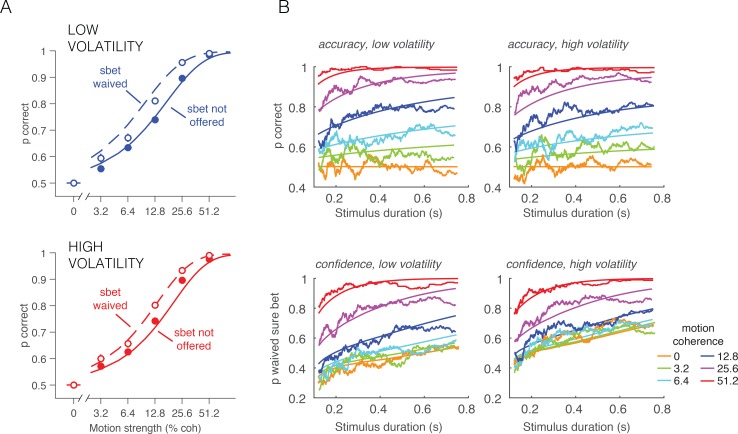
Figure 4—figure supplement 1. Accuracy and PDW behavior as a function of stimulus duration and sure-target availability.

Figure 4—figure supplement 1.

(A) Accuracy in the direction discrimination task was better when the monkey waived the sure-bet target (open symbols) than when it was not offered (filled symbols). Solid and dashed curves are model fits. By opting out of the direction decision on trials in which the evidence seemed unreliable, the monkey improved its accuracy on trials in which it waived the sure bet option and answered left or right. (B) Accuracy (top row) and proportion of waived sure bet (bottom row), as a function of stimulus duration and coherence (color coded). Smooth curves are fits of the bounded accumulation model. Jagged lines are running means of the data sorted by duration (300 trials per data point, plotted at their mean).