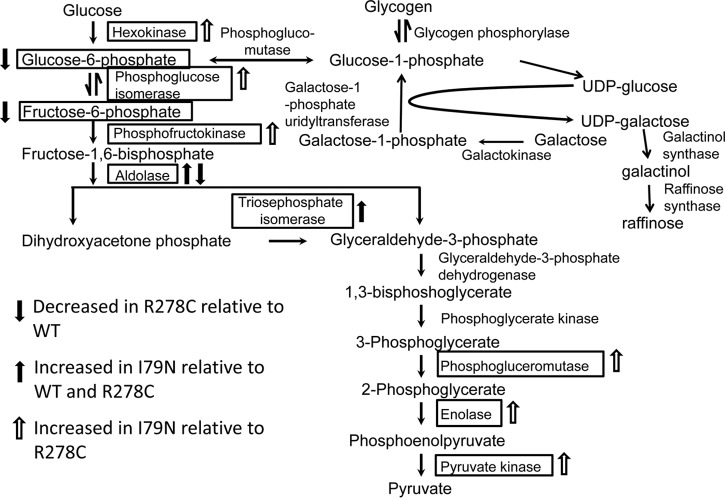
Fig. 9.
Changes in levels of metabolites and enzymes in the glycolytic pathway in R278C and I79N hearts. A solid black arrow indicates metabolite or enzyme is increased in I79N hearts relative to WT and R278C. An empty arrow indicates that the metabolite or enzyme is increased in I79N relative to R278C only. An arrow with gray fill indicates a decrease in R278C relative to WT. The galactose pathway is also shown (see Discussion and supplemental Fig. S3).

