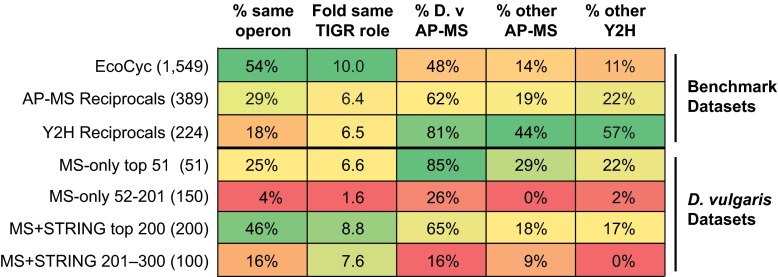
Fig. 5.
PPI quality metrics for benchmark data sets and high and low confidence D. vulgaris tagless protein pair sets. The top three rows show metrics for benchmark bacterial data sets: the EcoCyc complexes (41), and protein pairs that have been reciprocally confirmed in either four AP-MS studies, including ours, or in six Y2H studies (Experimental Procedures) (6). The remaining rows show metrics for sets of protein pairs identified by the MS-only and MS+STRING logistic regressions. The regression scores were used to rank and separate PPIs into a high and low scoring set in each case. The numbers of protein pairs in each set are given in brackets. The columns show from left to right: the percent of pairs whose members are encoded in the same operon; fold enrichment of pairs for which both members have the same TIGR role over that expected among randomly chosen pairs; percent overlap with PPIs from the D. vulgaris AP-MS interactome; percent overlap with a combined set of interologs from the three bacterial AP-MS interactomes for other bacterial species; and percent overlap with a combined set of interologs from the six bacterial Y2H interactomes (Experimental Procedures; supplemental Table S2).

