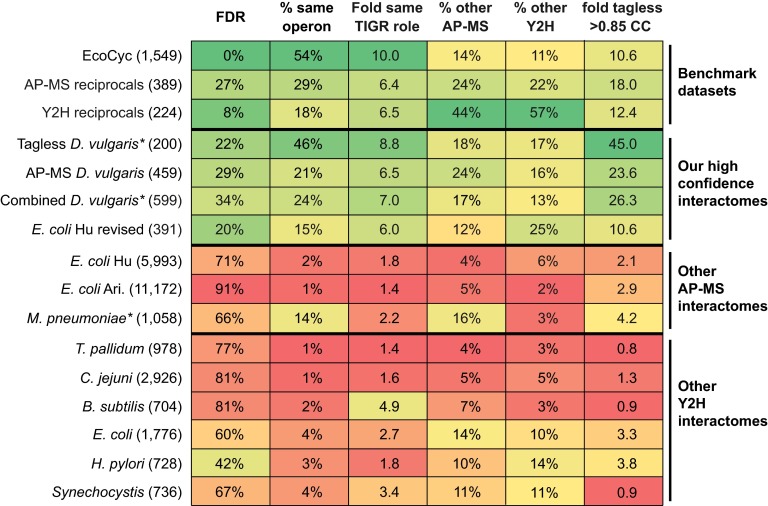
Fig. 7.
PPI quality metrics for benchmark data sets and proposed bacterial interactomes. The top three rows show metrics for the three benchmark data sets described in Fig. 5. The remaining rows show metrics for our tagless, AP-MS and combined interactomes; the three other AP-MS interactomes (25–27); and the six Y2H data sets (28–33), see Experimental Procedures. The numbers of protein pairs in each set are given in brackets. The left most column shows the FDR estimated using gold standard positive and negatives sets based only on complexes from the EcoCyc data set or, in the case of the non E. coli studies, their interologs. The right most column shows the fold enrichment of highly correlated co-occurring protein pairs found in our tagless assay (supplemental Table S1). The remaining columns are as in Fig. 5. Data sets for which genome location data was used in addition to interaction data to identify protein pairs are indicated with *.

