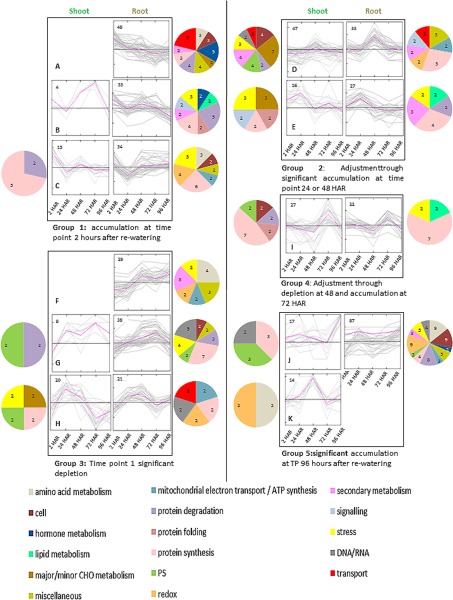
Fig. 2.
Correlative cluster analysis (K-means, A–K) of protein abundance from log transformed ratio (treatment versus control) showing significant changes in response to drought-recovery across five time points (ANOVA p ≤ 0. 05). Clusters were further grouped according to pattern similarity of response. Numbers of proteins are showen in each cluster. Pie charts of main functional groups of proteins (≥ 2 proteins) are represented corresponding to clusters (left for shoot, right for root).

