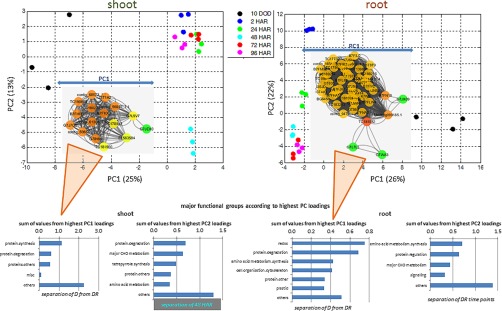
Fig. 3.
PCA of significant changed root and shoot protein and metabolite (treatment to control) ratio data. Inserted Functional Correlation Network Analysis (cytoscape) based on highest loadings (< −0.9 and > 0.9 as of PC loadings supplemental Table S3); Nod color = Edge-Betweenness increases from green to red. Sum of loading values of major functional groups (> three proteins).

