Fig. 4.
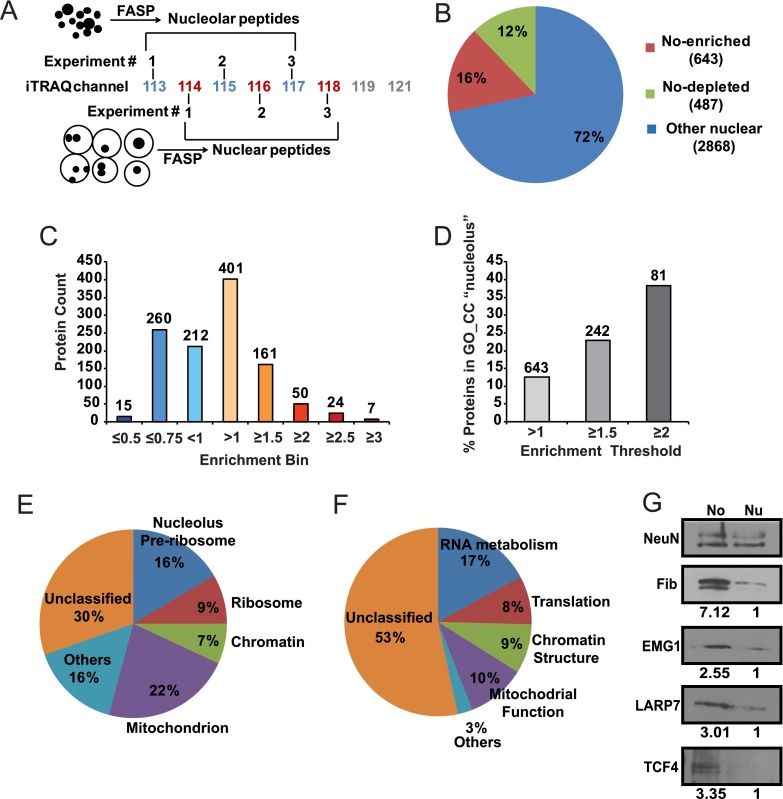
Analysis of the nucleolar proteome from the developing rat cerebral cortex. A, Three independent sets of total nuclear/nucleolar protein samples from the cerebral cortex of P7 rats were analyzed using quantitative iTRAQ proteomics. Filter Aided Sample Preparation (FASP) was applied to obtain peptides that were tagged using an 8-plex iTRAQ system for quantitative LC/MS analysis. B, The pie chart illustrates the numbers of proteins with differential abundance in the nucleolus (No). C, Distribution of relative No enrichments among 1130 differentially localized proteins. Numbers over the bars correspond to numbers of proteins in each enrichment bin. D, Increased No enrichment correlates with greater fraction of proteins that are associated with the gene ontology (GO) term “nucleolus”. Numbers over the bars correspond to numbers of proteins that are passing each enrichment threshold. E–F, Gene ontology (GO) analysis of 504 mapped proteins whose nucleolar enrichment was at least 1.3 fold. The significance threshold for GO enrichment was FDR<0.05. The pie charts present fractions of No proteins that were assigned to enriched GO_CC- (cellular compartment, E) or GO_BP (biological process, F) categories. Related terms were grouped together; overlapping GO assignments were avoided to accurately determine the fraction of unclassified proteins. More details about GO enrichment are in Tables I–III. G, Nucleolar enrichment of the candidate nucleolar proteins EMG1, LARP7, and TCF4 was verified by Western blotting. The nucleolar marker fibrillarin was used as a positive control. Numbers under the blots indicate relative nucleolar enrichment as determined by NeuN-normalized band intensity; for each analyzed protein, its NeuN-normalized content in the total nuclear lysate was defined as 1. Similar trends were observed in two independent experiments/isolations. The gel loading was as for Fig. 3C.

