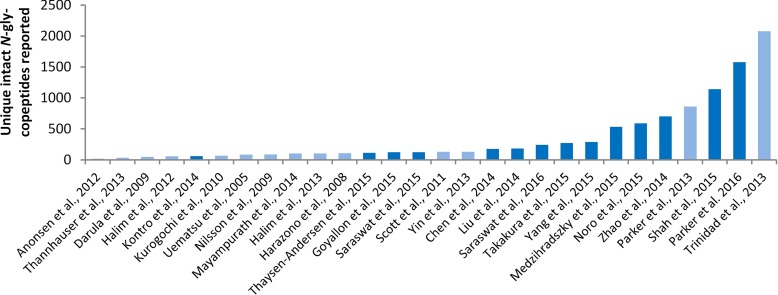
Fig. 5.
Nonchronological summary of the N-glycoproteome coverage as evaluated by the number of reported unique intact N-glycopeptides of glycoproteomics studies published over the past decade. Dark blue bars represent recent glycoproteomics studies (2014–present) covered in this review (see also Table II) and light blue bars represent older studies (2005–2014) covered elsewhere (59).

