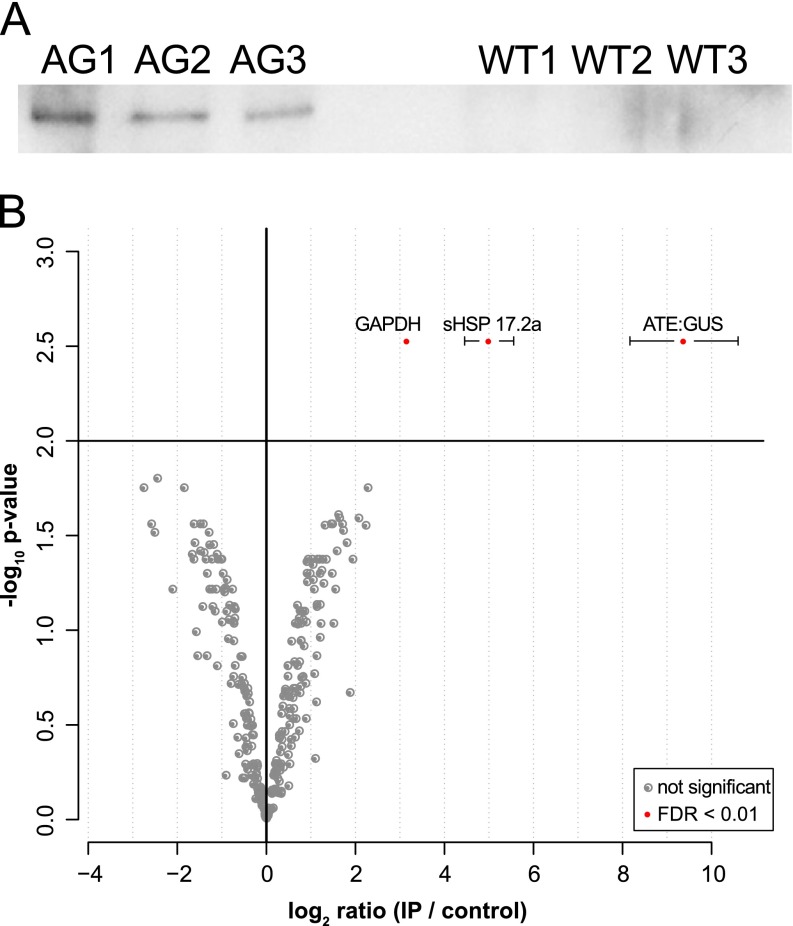
Fig. 2.
Results of the CoIP of total protein extracts from ATE:GUS #9 using anti-GUS antibodies. A, Western blot with anti-GUS (C-term) of the performed CoIP triplicates for ATE:GUS samples (AG1–3) and wild type samples (WT1–3). B, Distribution of protein ratios and p values. Ratios are averaged -log2-ratios of normalized protein intensities from three independent experiments (IP against ATE versus control IP, n > = 2); significantly enriched proteins are marked with filled red circles (adjusted p value <0.01, corresponding to <1% FDR). Error bars represent standard deviation of the mean for significant hits.

