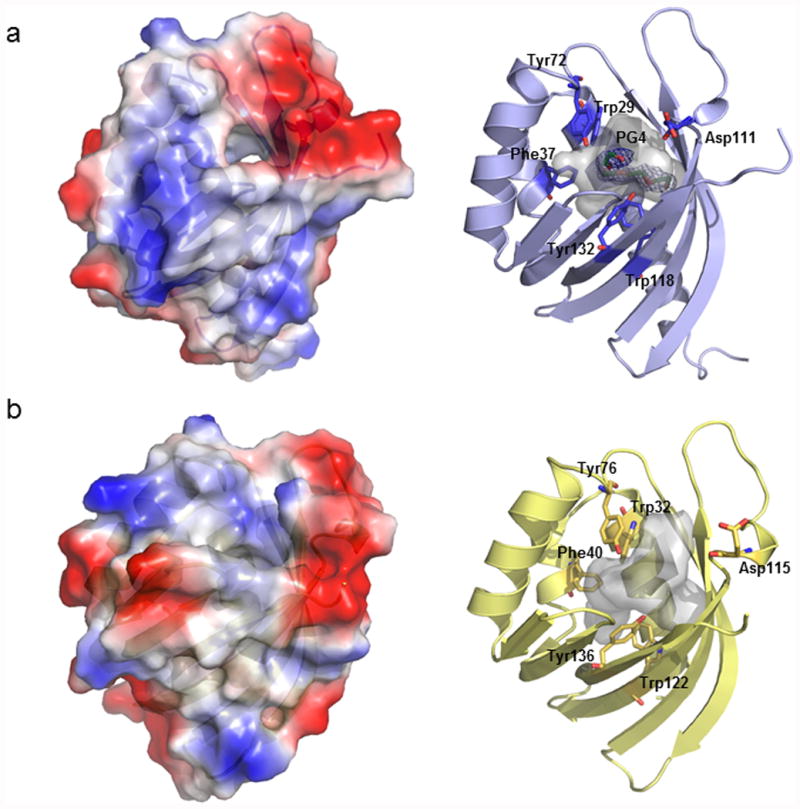
Figure 5.

Structure comparison between SgcJ and NCS-Orf16. The electrostatics diagrams (left) and the conserved residues around the cavities (right) of (a) SgcJ and (b) NCS-Orf16. The cavities are shown by grey transparency. The ligand tetraethylene glycol (PG4) molecule is colored in green. The 2Fo – Fc electron density map is contoured at 1.0.
