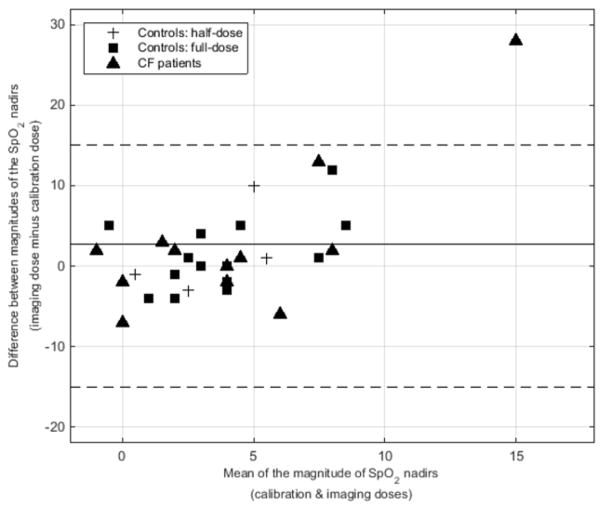
Fig. 1.
Bland–Altman plot shows a comparison of the magnitude of the SpO2 nadirs for the calibration and imaging doses for all three subject groups (controls with half-doses of hyperpolarized gas, controls with full doses, and children with cystic fibrosis, who all received full doses. Across all subjects and all doses, the mean difference in SpO2 nadir for the imaging and calibration doses was −2.7±7.7% (solid line; magnitude is plotted). Note the 95% confidence intervals (dashed lines). CF cystic fibrosis

