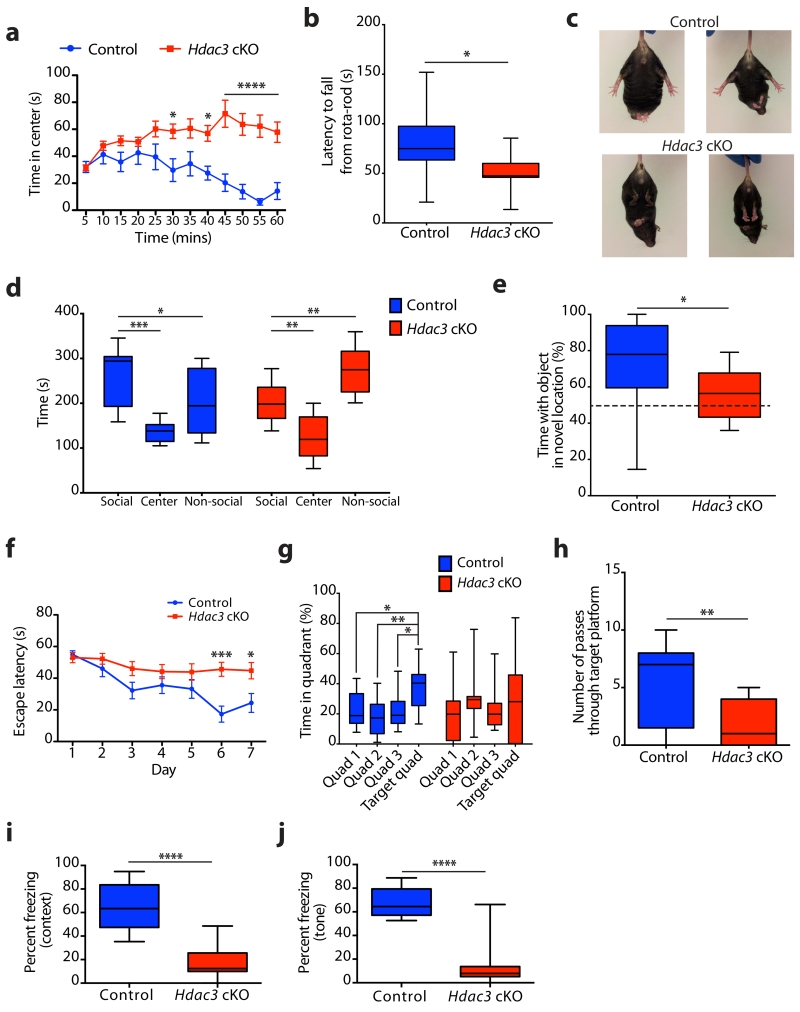
Figure 1. Hdac3 cKO mice exhibit social and cognitive impairments similar to models of RTT.
(a) Control and Hdac3 cKO mice were subjected to the open-field test for 60 minutes and analyzed in 5 minute bins for time spent in the center. Two-way ANOVA, genotype: F(1,44) = 24.82, **** P < 0.0001; time: F(11, 484) = 2.131, * P = 0.0171; Bonferroni post hoc; 30 min bin, * P = 0.0256; 40 min bin, * P = 0.0203; 45 min, 50 min, 55 min, 60 min bins, **** P < 0.0001; n = 22, 24 mice. (b) Latency to fall from an accelerating rota-rod (s), average of two trials per mouse for control and Hdac3 cKO mice; two-tailed t test; t(20) = 2.527; * P = 0.0201; n = 11, 11 mice. (c) Hind limb clasping phenotype was observed in Hdac3 cKO at 12 weeks of age, but not in controls. (d) Time spent in each chamber of the sociability arena (s) during 10 minutes with a novel mouse confined to one chamber (social) for control and Hdac3 cKO mice. Control; one-way ANOVA, F(2,24) = 11.10, *** P = 0.0004; Bonferroni post hoc, social versus non-social, * P = 0.0441; social versus center, *** P = 0.0002; n = 9, 9 mice. Hdac3 cKO; one-way ANOVA, F(2,24) = 21.65, **** P < 0.0001; Bonferroni post hoc, social versus non-social, ** P = 0.0065; social versus center, ** P = 0.0058; n = 9 mice. (e) Control and Hdac3 cKO mice were assessed for object location memory as the percent time spent with the object in the novel location versus time spent with the object in the familiar location; two-tailed t test; t(26) = 2.374; * P = 0.0253; n = 16, 12 mice. (f) The escape latency (s) to reach the hidden platform during the training days of the MWM was scored for control and Hdac3 cKO mice. Two-way ANOVA; genotype, F(1,133) = 23.65, **** P < 0.0001; day, F(6,133) = 5.624, **** P < 0.0001, Bonferroni post hoc; day 1, P > 0.99; day 2, P > 0.99; day 3, P = 0.2874; day 4, P > 0.99; day 5, P = 0.7824; day 6, *** P = 0.0003; day 7, * P = 0.0197; n = 10, 11 mice. (g) During the probe trial (day 8), the percent time spent in the target quadrant, and the 3 control quadrants was scored. Control; one-way ANOVA, F(3,36) = 4.789, ** P = 0.0066; Bonferroni post hoc; quadrant 1 (Q1) versus target quadrant (T), * P = 0.0325; Q2 versus T, ** P = 0.0037; Q3 versus T, * P 0.0225; n = 10 mice. Hdac3 cKO; one-way ANOVA, F(3,40) = 0.6259, P = 0.6025; Bonferroni post hoc; Q1 versus T, P > 0.99; Q2 versus T, P > 0.99; Q3 versus T, P > 0.99; n = 11 mice. (h) During the probe trial (day 8) the number of passes through the location where the hidden platform was positioned during the training (days 1 – 7) was calculated for control and Hdac3 cKO mice; two-tailed t test; t(19) = 3.056, ** P = 0.0065; n = 10, 11 mice. (i) Contextual fear-conditioned memory scored as percent time spent freezing during a 3 minute exposure to the context; two-tailed t test; t(20) = 6.719, **** P < 0.0001; n = 11, 11 mice. (j) Cued fear-conditioned memory scored as percent time spent freezing during a 3 minute exposure to the tone presented in a novel context; two-tailed t test; t(20) = 7.959, **** P < 0.0001; n = 11, 11 mice. a, f report mean value ± s.e.m. b, d, e, g - j, report median, 25th and 75th percentile, min and max value.

