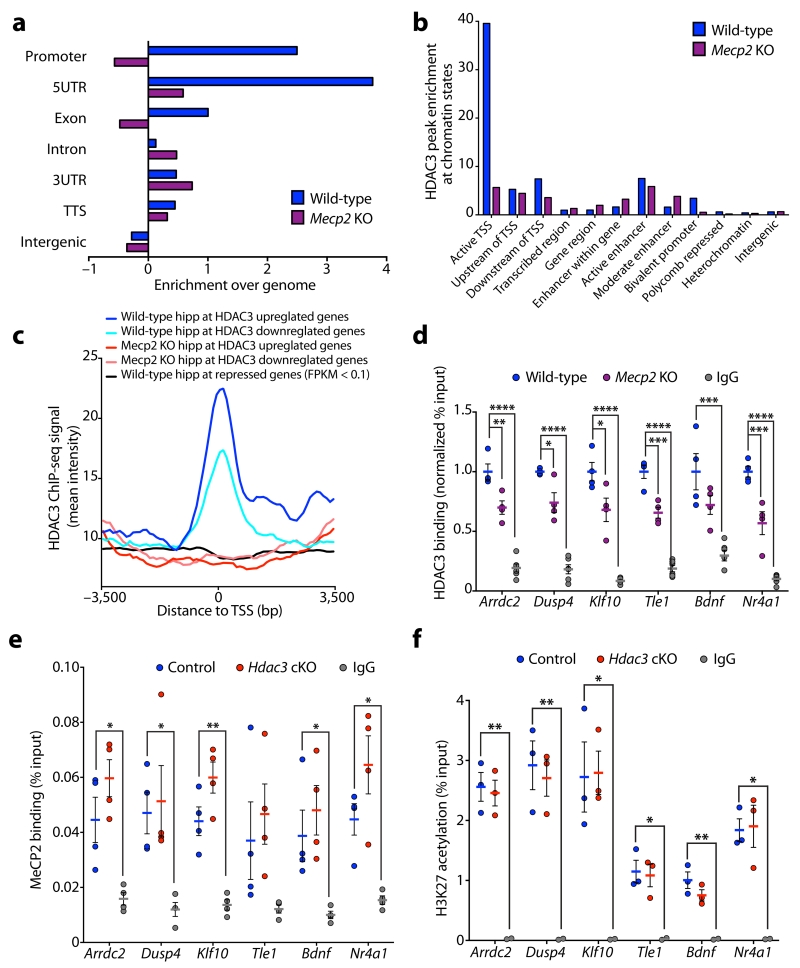
Figure 3. MeCP2 modulates HDAC3 localization to the promoters of transcribed genes.
(a) Enrichment of HDAC3 binding peaks in hippocampus of P45 wild-type and Mecp2 KO mice at annotated regions of the genome analyzed using Homer (enrichment over genome). TTS; transcriptional termination site, UTR; untranslated region. (b) Enrichment of HDAC3 binding peaks in hippocampus of P45 wild-type and Mecp2 KO mice at genomic regions analyzed using chromatin state profiling of the hippocampus. TSS; transcriptional start site. (c) Aggregate plots of average HDAC3 ChIP-seq intensity signal in P45 wild-type hippocampus (blue) and Mecp2 KO hippocampus (red). Aggregate plots were generated at the TSS of genes upregulated and downregulated in the CA1 of Hdac3 cKO mice. Aggregate plot of average HDAC3 ChIP-seq intensity signal at the TSS of genes with FPKM values below 0.1 in control hippocampal CA1 (black; negative control). TSS, transcriptional start site. (d) ChIP of HDAC3 and IgG followed by qPCR analysis at the promoters of Arrdc2, Dusp4, Klf10, Tle1, Bdnf, and Nr4a1 in cortex of P45 wild-type and Mecp2 KO mice (normalized % input to wild-type); one-way ANOVA; Arrdc2, F(2,11) = 74.68, **** P < 0.0001; Dusp4, F(2,11) = 75.39, **** P < 0.0001; Klf10, F(2,11) = 62.38, **** P < 0.0001; Tle1, F(2,11) = 106.5, **** P < 0.0001; Bdnf, F(2,11) = 16.68, **** P = 0.0005; Nr4a1, F(2,11) = 75.92, **** P < 0.0001; Bonferroni post hoc; wild-type versus Mecp2 KO: Arrdc2, ** P = 0.0039; Dusp4, * P = 0.0119; Klf10, * P = 0.0112; Tle1, *** P = 0.0003; Bdnf, P = 0.1318; Nr4a1, *** P = 0.0005; wild-type versus IgG: Arrdc2, **** P < 0.0001; Dusp4, **** P < 0.0001; Klf10, **** P < 0.0001; Tle1, **** P < 0.0001; Bdnf, *** P = 0.0003; Nr4a1, **** P < 0.0001; n = 4, 4, 6 mice. (e) ChIP of MeCP2 and IgG followed by qPCR analysis at the promoters of Arrdc2, Dusp4, Klf10, Tle1, Bdnf, and Nr4a1 in hippocampal CA1 region of 3-month control and Hdac3 cKO mice (% input); one-way ANOVA; Arrdc2, F(2,9) = 12.58, ** P = 0.0025; Dusp4, F(2,9) = 6.043, * P = 0.0217; Klf10, F(2,9) = 26.48, *** P = 0.0002; Tle1, F(2,9) = 2.967, P = 0.1024; Bdnf, F(2,9) = 6.930, * P = 0.0151; Nr4a1, F(2,9) = 12.53, ** P = 0.0025; Bonferroni post hoc; control versus Hdac3 cKO: Arrdc2, P = 0.2449; Dusp4, P > 0.9999; Klf10, P = 0.0727; Tle1, P > 0.9999; Bdnf, P = 0.8101; Nr4a1, P = 0.1520; control versus IgG: Arrdc2, * P = 0.0205; Dusp4, * P = 0.0398; Klf10, ** P = 0.0022; Tle1, P = 0.2465; Bdnf, * P = 0.0490; Nr4a1, * P = 0.0314; n = 4, 4, 4 mice. (f) ChIP of H3K27ac and IgG followed by qPCR analysis at the promoters of Arrdc2, Dusp4, Klf10, Tle1, Bdnf, and Nr4a1 in hippocampal CA1 region of 3-month control and Hdac3 cKO mice (% input); one-way ANOVA; Arrdc2, F(2,5) = 37.22, *** P = 0.0010; Dusp4, F(2,5) = 19.15, ** P = 0.0045; Klf10, F(2,5) = 9.955, * P = 0.0181; Tle1, F(2,5) = 10.58, P = 0.0160; Bdnf, F(2,5) = 17.82, ** P = 0.0053; Nr4a1, F(2,5) = 13.43, ** P = 0.0098; Bonferroni post hoc; control versus Hdac3 cKO: Arrdc2, P > 0.9999; Dusp4, P > 0.9999; Klf10, P > 0.9999; Tle1, P > 0.9999; Bdnf, P = 0.3040; Nr4a1, P > 0.9999; control versus IgG: Arrdc2, ** P = 0.0011; Dusp4, ** P = 0.0045; Klf10, * P = 0.0220; Tle1, * P = 0.0165; Bdnf, ** P = 0.0041; Nr4a1, * P = 0.0122; n = 3, 3, 2 mice. d – f, report mean value ± s.e.m.

